Solana (SOL/USD) Trade Is Correcting, Trying to Make a Base
Estimated Reading Time: 3 minutes
Don’t invest unless you’re prepared to lose all the money you invest. This is a high-risk investment and you are unlikely to be protected if something goes wrong. Take 2 minutes to learn more

Solana Price Prediction – February 23
The previous uprising forces occurred in favor of bulls to showcase that the SOL/USD trade pushed close to the resistance of $120, given that the crypto-economic trade is correcting, trying to make a base.
As it is, most indicators are pointing toward the south direction to envisage that some lines are probably going to be pushed through to the downside before a formidable baseline will be achieved. It’s possible that during lunchtime, there will be some downward movements before the buying cycle returns.
SOL/USD Market
Key Levels:.
Resistance levels: $120, $130, $140
Support levels: $80, $75, $70
SOL/USD – Daily Chart
The SOL/USD daily chart reveals that the crypto-market is correcting, trying to make a base.
The stochastic oscillators have their blue part into the oversold region, indicating that a downward falling force is yet to be over. The Bollinger Band trend lines have been within $120 and $85. At this point, it will be logically ideal for traders who intend to play alongside pressures to the negative to hold back for a while.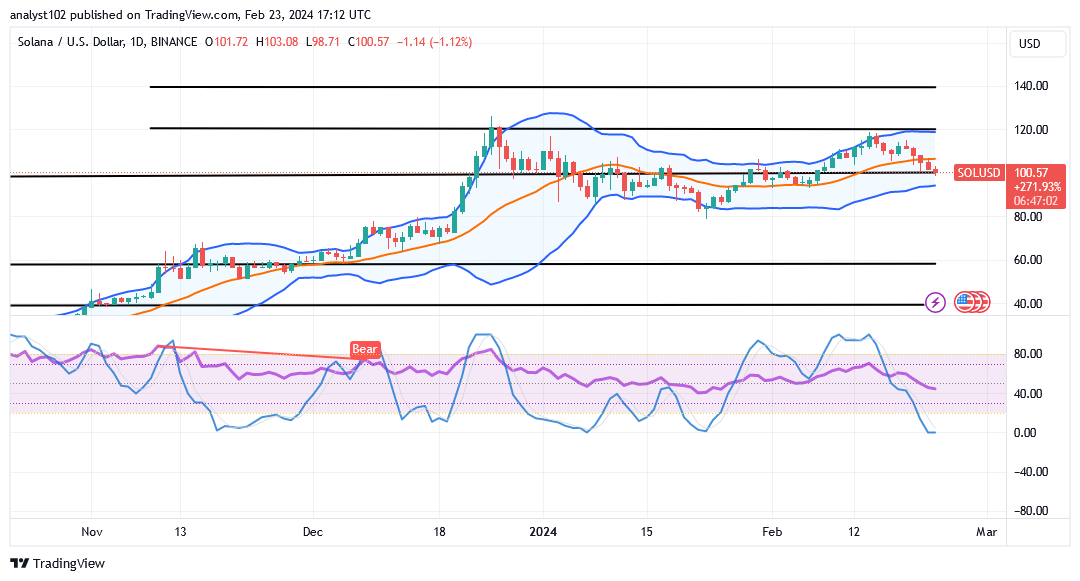
Can traders anticipate additional declines against the lower Bollinger of the SOL/USD trade as the price is at $100.57?
Considering the positioning arena of the lower Bollinger Band, it appears not been too far above the underlying support of $80 that further forces to the downside won’t be freely coming forth to the extent of letting in free fall-offs, as the SOL/USD market is observed to be correcting, trying to make a base.
Long-position placers are required to wait until there will be an emergence of a bullish candlestick spanning up back from around the lower Bollinger Band to the middle counterpart to launch a buy entry order. Meanwhile investors may start putting back some muscles to acquire the market at lesser costs.
Based on the technical point of view, bears’ tendency capacity to steal push the market line freely seems to be getting exhausted as the price is averaging the lower Bollinger Band. If that sentiment is anything to go by, it will be mentally sound well for sellers to suspend their intentions to push more, even not to think of profiteering against the lower part of the indicators.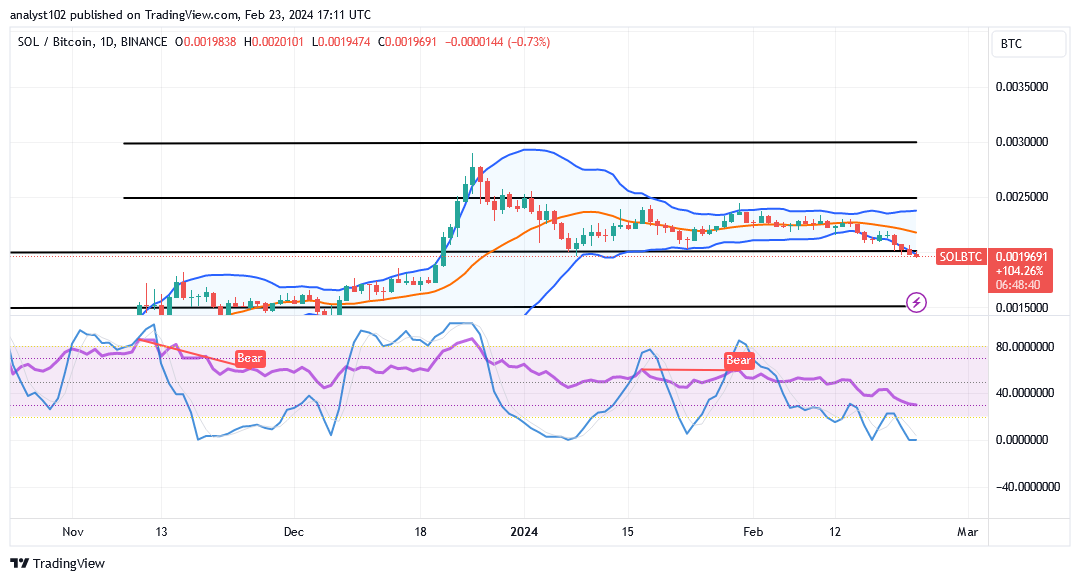
SOL/BTC Price Analysis
In contrast, the Solana market is correcting against Bitcoin at the lower Bollinger Band, seemingly trying to make a base out of it.
For some time now, the stochastic oscillators have been consolidating around lower values and the oversold area, suggesting that sellers are somewhat debasing the forces. The Bollinger Band indicators are at the lower side, stretching slowly in accordance to the level of declining forces that being experienced Although there’s still a chance, there doesn’t seem to be much hope for the base cryptocurrency to rise further.
Note: Cryptosignals.org is not a financial advisor. Do your research before investing your funds in any financial asset or presented product or event. We are not responsible for your investing results.
You can purchase Lucky Block here. Buy LBLOCK