UMA (UMAUSD) Fails to Sustain Its Upward Push and Drops Back to Support
Don’t invest unless you’re prepared to lose all the money you invest. This is a high-risk investment and you are unlikely to be protected if something goes wrong. Take 2 minutes to learn more
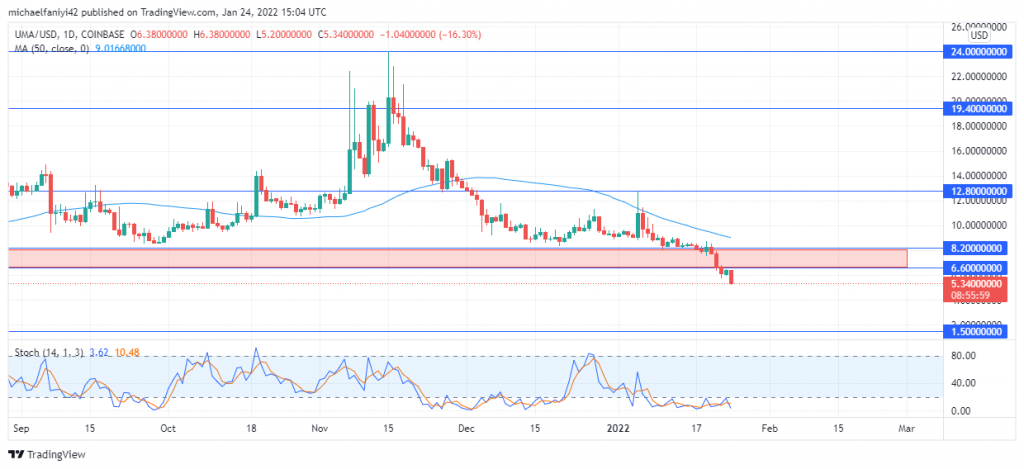
UMA Analysis – Price Fails to Break Past Its Current Resistance and Falls Back to Support
UMA fails to sustain its push for a drive upward and drops back to the support level at $8.500. The market has been found hovering along the support level, but sudden waves of market volatility have jacked the coin upwards towards the resistance level. The first was on December 27th, 2021, when prices could only make it as far as $10.500. The second volatile push-up comes on the 5th of January, in which the coin pierces through $12.000 but fails to sustain it.
UMA Key Levels
Resistance Levels: $12.000, $20.000
Support Levels: $8.500, $7.500
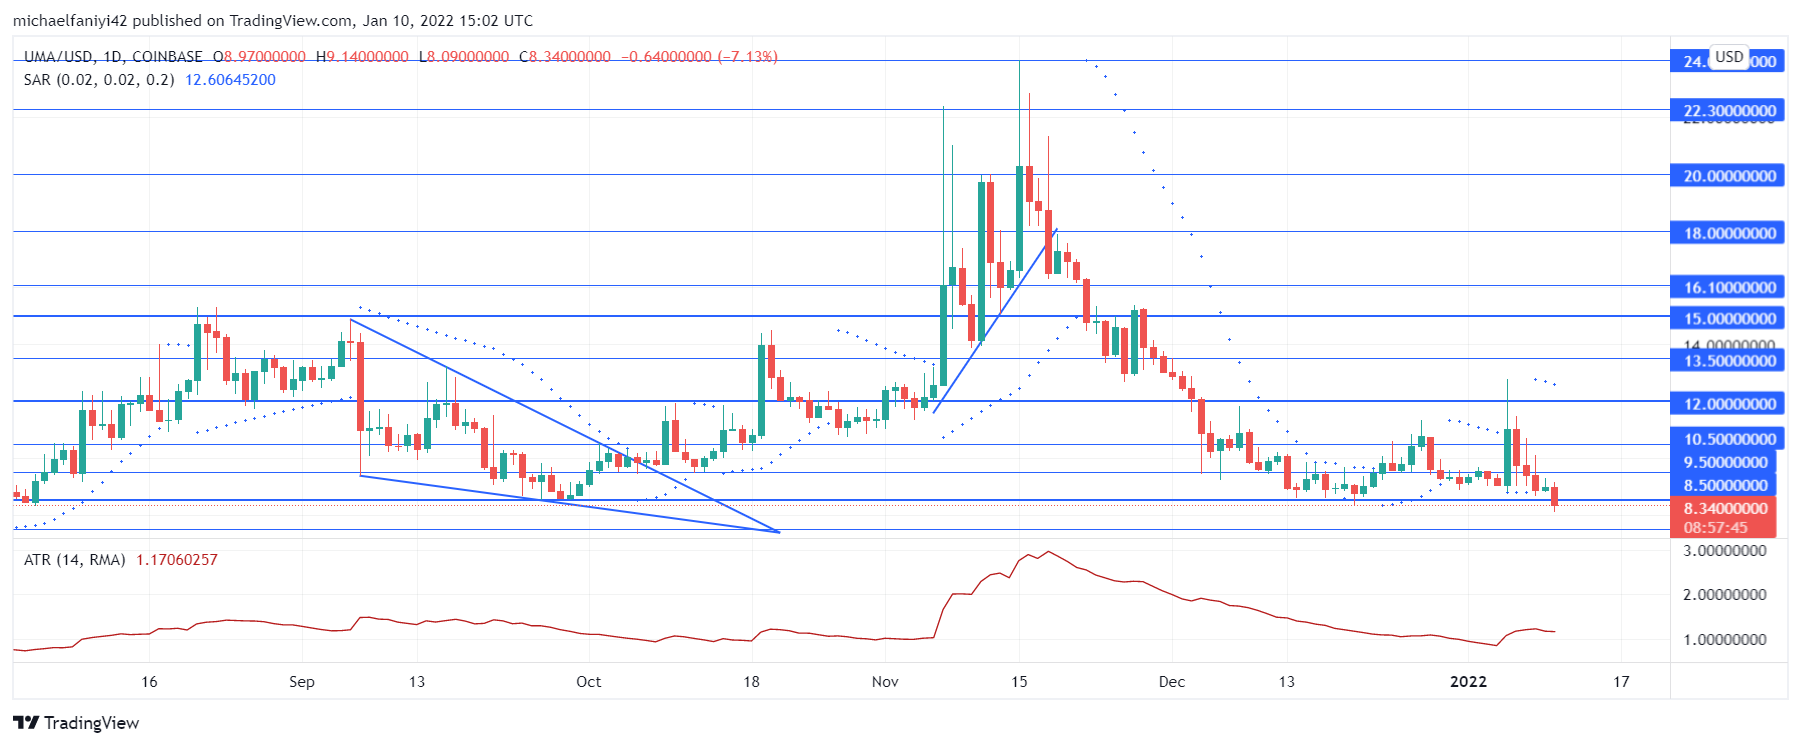
A similar volatile push in previous times has helped the coin break this same barrier. The first instance came on October 19th, 2021. Though the price pulled back below the resistance, the more intense volatility helped the market finally break the barrier and surged upwards by nearly 50% to reach the $22.300 price level. Though the coin dropped, it kept an uptrend and surged again, even higher to $24.000.
However, after 2 weeks of volatile upward movement, weakness crept into the market and UMA began sliding downwards. The price drop continued, largely unchallenged. This continues till UMA slumps to the $8.500 support level. Since then, the coin has laid low with only flashes of volatile action, of which the most significant on the ATR (Average True Range) indicator is the most recent one.

Market Anticipation
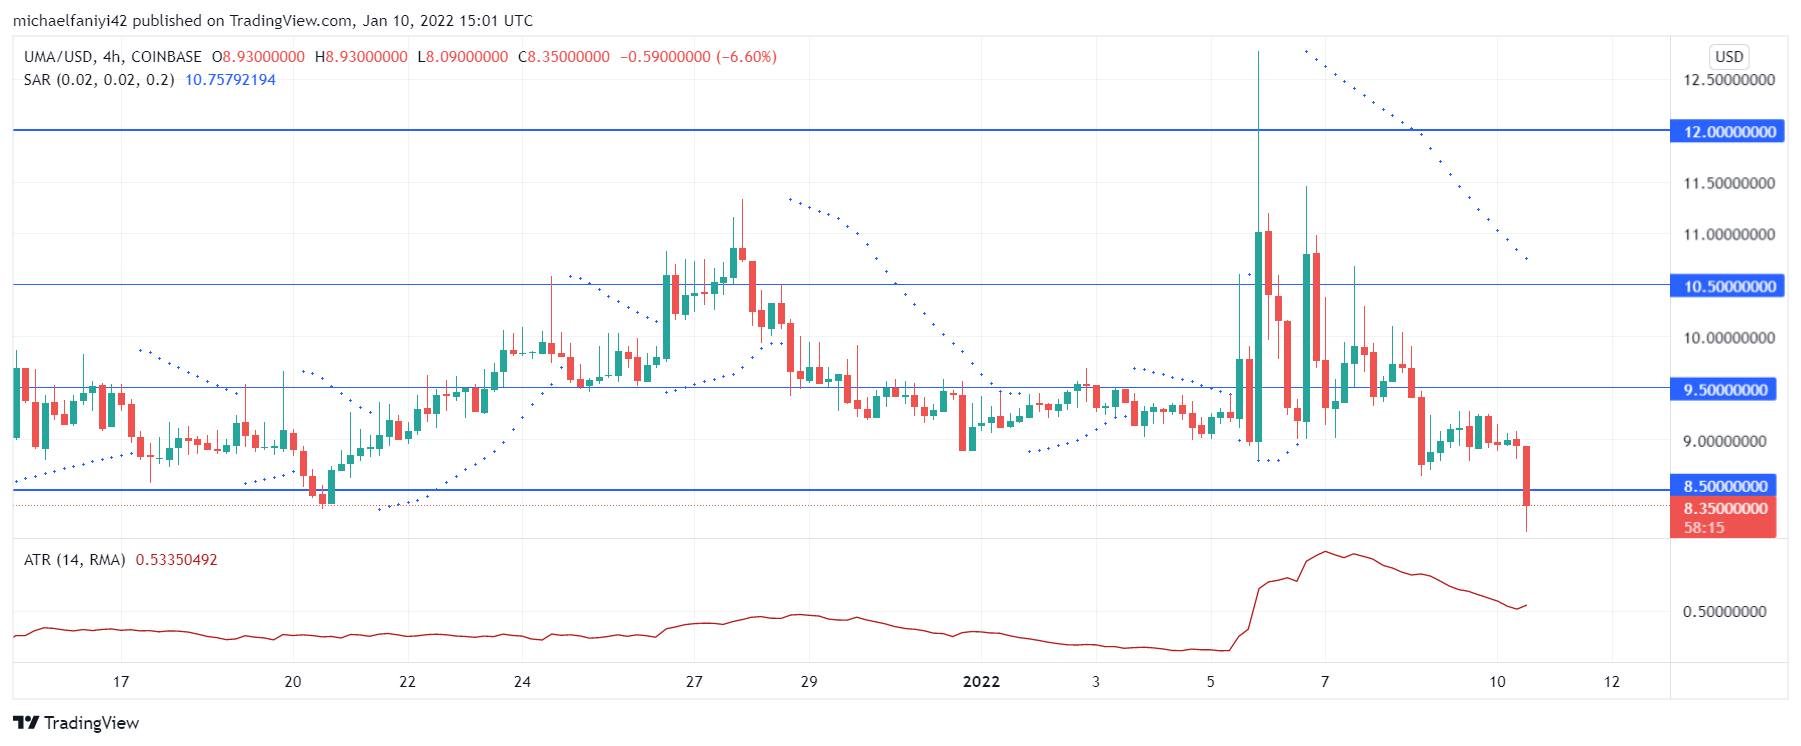
On the 4-hour chart, despite the volatile push-ups, the Parabolic SAR is still indicating a downtrend in the market as the price falls back to the support level. It is anticipated that after a while, there will be more volatile push-ups toward the resistance level, which UMA will likely drive towards the $13.500 price level.
You can purchase crypto coins here: Buy Tokens
Note: Cryptosignals.org is not a financial advisor. Do your research before investing your funds in any financial asset or presented product or event. We are not responsible for your investing results.