Uniswap (UNI/USD) Market Returns to a Declining Motion
Estimated Reading Time: 3 minutes
Don’t invest unless you’re prepared to lose all the money you invest. This is a high-risk investment and you are unlikely to be protected if something goes wrong. Take 2 minutes to learn more

Free Crypto Signals Channel
UniswapPrice Prediction – April 7
The recent rallying forces in the UNI/USD trade operations have started, witnessing retardation at a higher trading resistance spot as the crypto-economic market returns to a declining motion. Price has once dropped lower to around $9. But, it now trades at $10, keeping a positive percentage rate of 2.05.
UNI/USD Market
Key Levels:
Resistance levels: $12, $14, $16
Support levels: $8, $6, $4
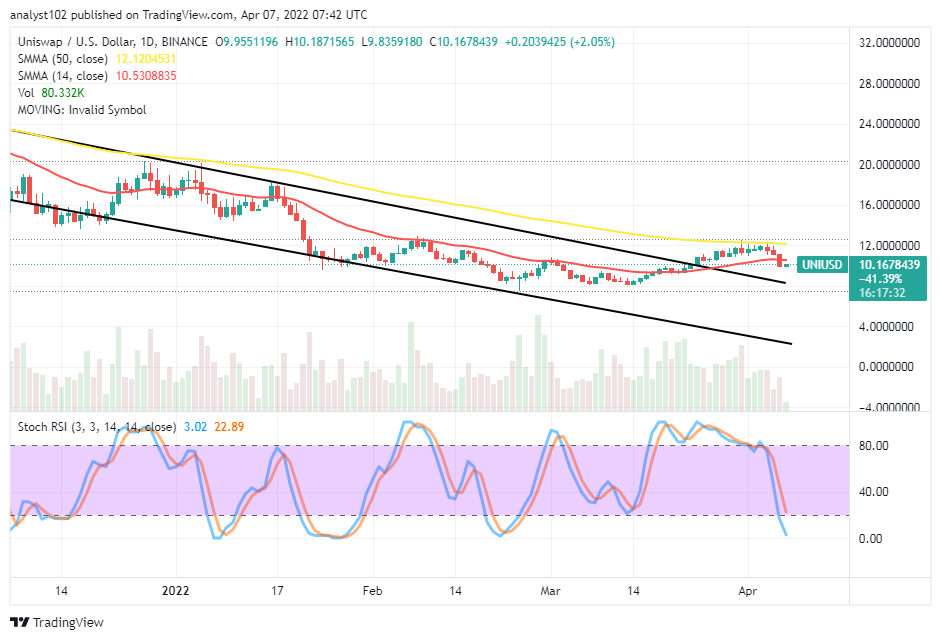
UNI/USD – Daily Chart
The UNI/USD daily chart showcases the crypto-economic market returns to a declining motion while it couldn’t surge northward further to break the $12 resistance level. The 50-day SMA indicator is above the 14-day SMA indicator. The upper bearish trend line drew southward to markdown the critical support point at $8 for the crypto economy. The Stochastic Oscillators have briefly moved into the oversold region, pointing to the south closer to the range-line at zero.
Can there be more downs past the $8 critical support level as the UNI/USD market returns to a declining motion?
The UNI/USD trade activities have featured within the levels of $12 and $8, serving as major trading spots for the duo trading instrument pair. It now records that the crypto-economic market returns to a declining motion against the US Dollar. The trading outlook suggests there is still a chance of the downside. Therefore, bulls may have to exercise patience for a while until a pattern confirming the exhaustion of the downward force to around the point termed the critical level achieved afterward to consider making a comeback.
On the downside of the technical analysis, the UNI/USD market bears should have joined the trend around the $12 resistance level. The situation still appears that a selling wall has been in the crypto-economic business transactions. And it has not been utilized owing to less-active force movement of the market. Shorting of sell orders at this point may run into a whipsawed trading moment in no time.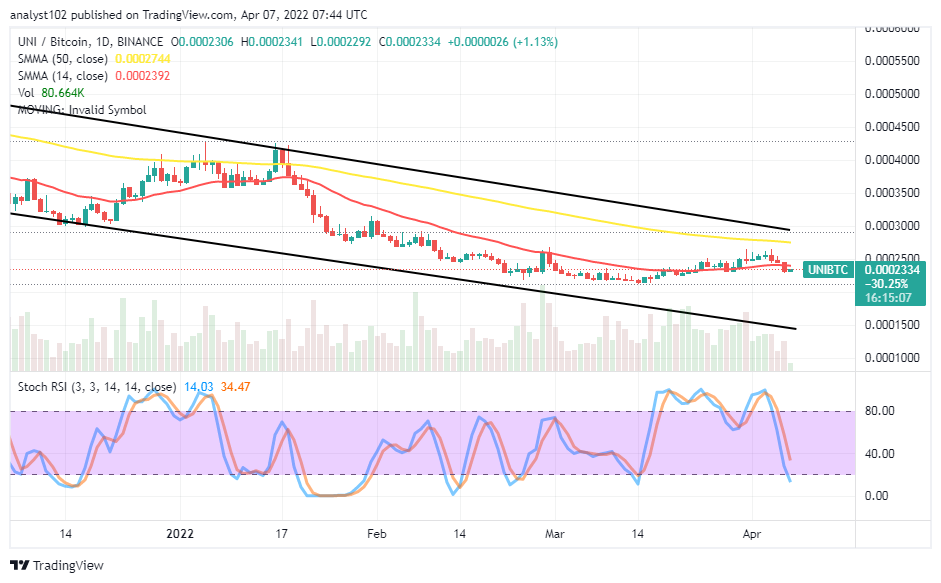
UNI/BTC Price Analysis
In comparison, Uniswap is now losing its stance to Bitcoin around the trend line of the smaller SMA. The 14-day SMA indicator is underneath the 50-day SMA indicator. The Stochastic Oscillators have slightly dipped past the range of 20 into the oversold region. The bearish channel trend lines drew southward, embodying the SMAs. A smaller bearish candlestick has formed against the trend line of the 14-day SMA to indicate the base crypto is losing to the counter crypto on a lighter note.
Note: Cryptosignals.org is not a financial advisor. Do your research before investing your funds in any financial asset or presented product or event. We are not responsible for your investing results.
You can purchase Lucky Block here. Buy LBlock: