Uniswap (UNI/USD) Price Swings at the Lower Range-Line
Estimated Reading Time: 3 minutes
Don’t invest unless you’re prepared to lose all the money you invest. This is a high-risk investment and you are unlikely to be protected if something goes wrong. Take 2 minutes to learn more
Uniswap Price Prediction – December 2
The UNI/USD economic price swings at the lower range-line 0f $20, trading around the $22 market line as of writing. The crypto trade operations possess an average percentage rate of about 6.65. That indicates upsurges have been piling up in the market.
UNI/USD Market
Key Levels:
Resistance levels: $25, $28, $31
Support levels: $19, $17, $15
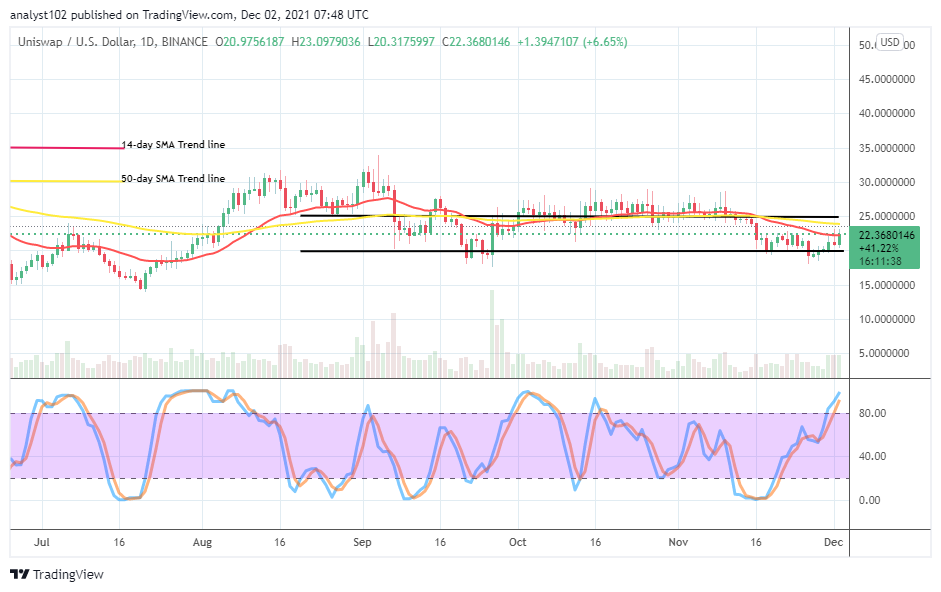
UNI/USD – Daily Chart
The UNI/USD daily chart reveals that the crypto-economic price swings at a lower range-line of $20 to touch the trend line of the smaller SMA. The upper range-line is at the $25 level. The 50-day SMA trend line is above the 14-day SMA trend line within the range-bound levels. The Stochastic Oscillators have protruded into the overbought region, pointing northbound within it. That suggests that some upward pressures may still play out to some reasonable extent.
Are there firm indications backing the UNI/USD market pushes northward more as the crypto-economic price swings at the lower range-line?
The ascertained degree measurement of the pace at which the UNI/USD market has been pushing is yet to convincingly break away from the range-bound zones it has kept over time as the crypto-economic price swings at the lower range-line presently. The lower range-line has severally been witnessing notable reliable upswings in the recent past operations as the market poises to change the range-bound trend.
On the downside of the technical analysis, the UNI/USD market shirt-position takers may get vigilant by looking for a moment of resistance trading condition re-occurring around the previous higher zones of $25 and in an extension of around $28 to consider the launching of a sell position. A bearish candlestick is needed to emerge around one of those higher trading zones for a confirmation of that presumed scenario playing out decently.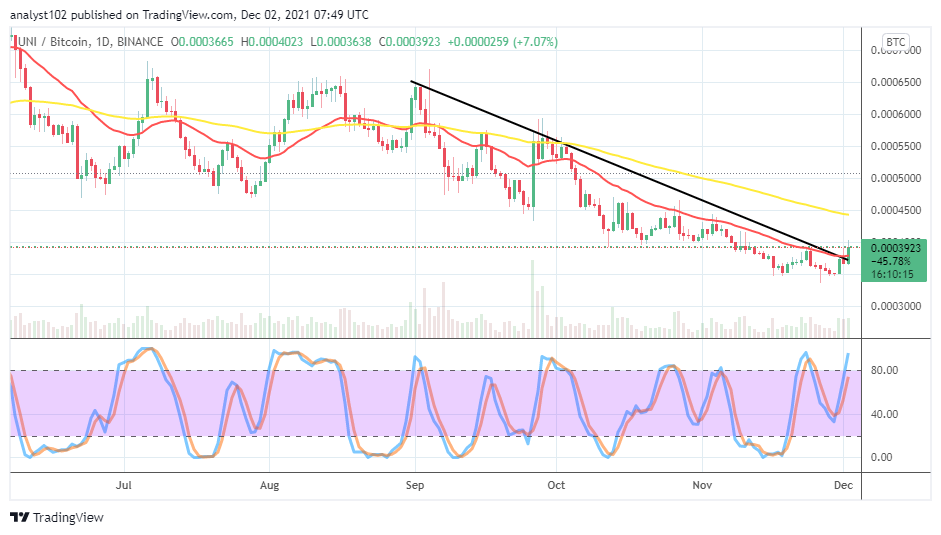
UNI/BTC Price Analysis
In the comparison, the trending capacity of Uniswap as paired with Bitcoin is yet to come out of depressive forces inflicted on the market by the counter trading instrument. The currency pair price swings northward against the trend line of the smaller SMA. The 50-day SMA indicator is above the 14-day SMA indicator. The Stochastic Oscillators have moved from range 40 into the overbought region, pointing toward the north side. That suggests that the base crypto is on the verge of struggling to push against the counter flagship crypto.
Note: Cryptosignals.org is not a financial advisor. Do your research before investing your funds in any financial asset or presented product or event. We are not responsible for your investing results.
You can purchase crypto coins here. Buy Tokens