Wall Street Memes (WSM) Price Drops, Primed to Lift
Estimated Reading Time: 4 minutes
Don’t invest unless you’re prepared to lose all the money you invest. This is a high-risk investment and you are unlikely to be protected if something goes wrong. Take 2 minutes to learn more

Wall Street Memes Price Prediction – November 2
Sequencing to a brief decline in Wall Street Memes (WSM) valuation, investors observed the dip coinciding with a mild rebound in the US dollar’s purchasing strength. The development has reignited investor confidence, as traders begin aligning for an anticipated rebound in WSM’s price.
The renewed investor confidence suggests that accumulation pressure may be building, with technical indicators hinting at a potential momentum shift. As market liquidity stabilizes and sentiment strengthens, WSM market could be gearing up for a substantial upside move, especially if buying interest expands above near-term resistance levels.
WSM/USD Market
Key Levels
Resistance levels: $0.0006, $0.0007, $0.0008
Support levels: $0.00035, $0.0003, $0.00025
WSM/USD – 4-hour Chart
The WSM/USD medium-term chart mirrors it in that the crypto trades drop slightly, priming for a lift-up in no time.
The Bollinger Bands are gradually widening, indicating a rise in market volatility and a sustained downward drive toward the lower trading zone, as moderate yet persistent selling pressure continues to build over time. Meanwhile, the Stochastic Oscillators remain deeply positioned in the oversold region, reflecting sustained market pressure that could soon trigger a bullish correction.
Could the Wall Street Memes (WSM) Price Drop Be Signaling a Strong Bullish Reversal Ahead?
The recent pullback in Wall Street Memes (WSM) appears more corrective than bearish, reflecting underlying market strength. Renewed investor participation and improving sentiment suggest the coin could soon regain traction, building sustained upward momentum toward higher valuation territories.
Wall Street Memes (WSM) shows signs of a healthy correction rather than weakness, with accumulating strength near support levels. Technical indicators and improving sentiment suggest growing bullish momentum, positioning the coin for a potential rebound toward higher price territories.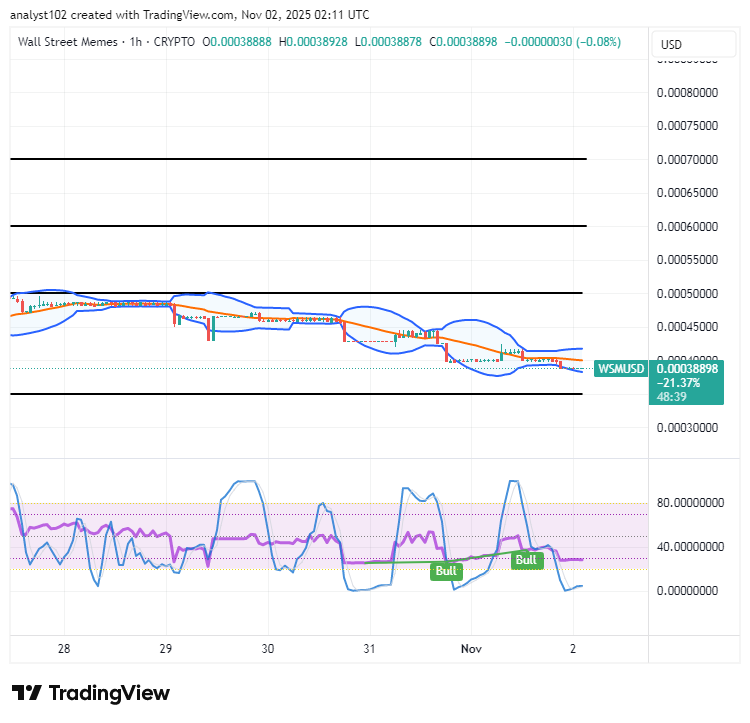
WSM/USD 1-hour chart
The WSM/USD short-term (1-hour chart) reveals the crypto-economic trade drops slightly, primed to lift up soon.
The Stochastic Oscillators remain positioned within a bullish threshold pattern, signaling that buying forces are preparing to take a decisive lead in the near future, reflecting renewed optimism across short-term momentum indicators. The Bollinger Bands are trending downward, positioning the market for potential recovery entries from lower spots, as volatility compresses and price action steadies for upward expansion.
BIGTIMEUSDT & WSMUSDT Contracts now live on Bybit!
Dive into exciting new trading opportunities with up to 1-25x leverage. Plus, they’re now fully supported on Bybit Futures Grid Bot for smarter automated strategies. Start trading now and maximize your potential!
BIGTIME: [https://i.bybit.com/20rabgrK](https://i.bybit.com/20rabgrK)
WSM: [https://i.bybit.com/ab1F9gWH](https://i.bybit.com/ab1F9gWH)
🚀 BIGTIMEUSDT & WSMUSDT Contracts now on Bybit!
— Bybit (@Bybit_Official) October 12, 2023
Dive into new trading opportunities with 1-25x leverage. Plus, they’re now on Bybit Futures Grid Bot! Start trading now.
📈 BIGTIME: https://t.co/FAQlbhnzAh
📈 WSM: https://t.co/pb2y2AfMBE#CryptoTrading #Bybit
Buy and stake WSM now! https://wallstmemes.com/