Wall Street Memes (WSM) Price Is Grounded, Breeding Recoveries
Estimated Reading Time: 3 minutes
Don’t invest unless you’re prepared to lose all the money you invest. This is a high-risk investment and you are unlikely to be protected if something goes wrong. Take 2 minutes to learn more

Wall Street Memes Price Prediction – August 7
Purchasing strength pace that the WSM/USD market bulls have put in place has still not been practically active away from the trade line of 40.0006, as the situation reveals that the crypto-economic price is grounded, breeding recovery signs.
Long-term investors may find renewed optimism as WSM/USD enters a pivotal consolidation phase near the $0.0006 level—an area often known for birthing trend-defining reversals. While the current price behavior may appear uncertain, this stage could mark the groundwork for a sustained upward trajectory, encouraging strategic patience over reactive exits.
WSM/USD Market
Key Levels
Resistance levels: $0.0008, $0.0009, $0.001
Support levels: $0.0005, $0.0004, $0.0003
WSM/USD – 4-hour Chart
The medium-term chart of the WSM/USD presently shows that the base crypto economy is grounded, breeding recovery signs.
The Bollinger Bands indicators remain in a slight-losing mode at the lower band, clearly indicating that energy recouping is gradually unfolding within the overall crypto market trend. The stochastic oscillator is still positioned southbound, attempting to get a re-positional order toward the oversold region for a possible technical reset.
Should Short-Term Sellers Rethink Offloading WSM/USD at $0.0006 Amid Signs of a Rebound?
Short-term sellers should reconsider, as technical signals suggest a potential rebound from the $0.0006 zone, making premature exits potentially unfavorable, given that the WSM/USD trade is grounded, breeding recovery signs.
Given the technical positioning of key indicators within lower trade zones, all signals are increasingly aligning with sustained rebound prospects, as previously projected. If that technical premise holds, investors are strongly encouraged to maintain market exposure and continue holding positions amid emerging upside potential.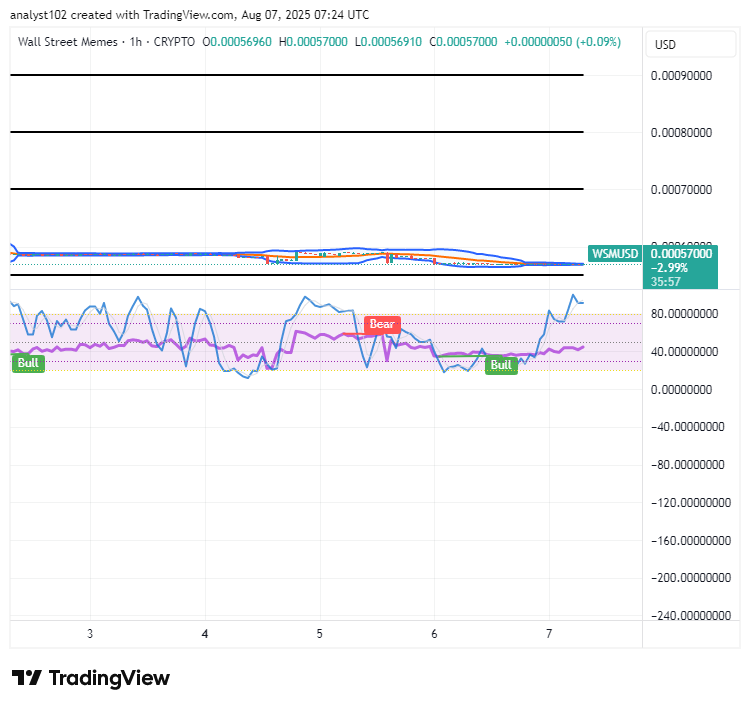
WSM/USD 1-hour chart
The 1-hour chart of the WSM/USD market is grounded, breeding recovery signs in its positional output.
The Bollinger Bands have subtly compressed in a downward realignment along the range-bound thresholds, suggesting a potential volatility breakout. Meanwhile, the stochastic oscillators are gradually curving upward into the overbought territory, indicating that bullish momentum is steadily gaining traction.
Explore fresh trading opportunities with 1-25x leverage and advanced automation tools—now available on Bybit Futures Grid Bot. Kick off your trading journey today!
BIGTIME: [https://i.bybit.com/20rabgrK](https://i.bybit.com/20rabgrK)
WSM: [https://i.bybit.com/ab1F9gWH](https://i.bybit.com/ab1F9gWH)
🚀 BIGTIMEUSDT & WSMUSDT Contracts now on Bybit!
— Bybit (@Bybit_Official) October 12, 2023
Dive into new trading opportunities with 1-25x leverage. Plus, they’re now on Bybit Futures Grid Bot! Start trading now.
📈 BIGTIME: https://t.co/FAQlbhnzAh
📈 WSM: https://t.co/pb2y2AfMBE#CryptoTrading #Bybit