Wall Street Memes (WSM) Trade Pushes, Making Rises
Estimated Reading Time: 3 minutes
Don’t invest unless you’re prepared to lose all the money you invest. This is a high-risk investment and you are unlikely to be protected if something goes wrong. Take 2 minutes to learn more
Wall Street Memes Price Prediction – February 8
Over a couple of running sessions, it is demonstrated that bears are losing stances gradually against bulls, as the present economic situation experiences the WSM/USD market positively pushing, making rises in its signal note.
The oscillating indicators’ fluctuating movement suggests that long-term investors are actively positioning for a potential breakout to higher values over time. In light of this, it is strongly recommended that investors maintain their positions and stay committed to their staking strategies.
WSM/USD Market
Key Levels
Resistance levels: $0.0015, $0.002, $0.0025
Support levels: $0.0005, $0.0004, $0.0003
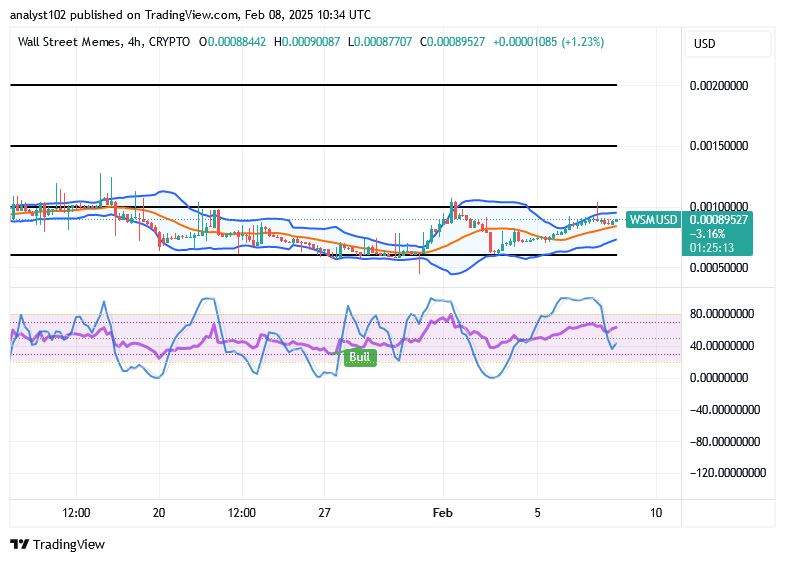
WSM/USD – 4-hour Chart
The WSM/USD market 4-hour chart showcases that the crypto-economic trade currently pushes, making rises in inputs.
The formation pattern of the candlesticks has been majorly characterized by lower highs than lower lows in the northward-positioning postures of the Bollinger Bands indicators. The stochastic oscillators are positioned southbound close to the line of 20, attempting to point back to the upside.
At what key indicator levels should buyers remain cautious of potential declines as the WSM/USD pair continues its upward movement?
Considering the present trade level of the WSM/USD market at $0.00089527 with a smaller bullish candlestick averaging the point of $0.001, buyers would have to be wary of underlying support built around $0.0006, as the crypto market pushes, making rises in inputs.
The stochastic oscillators are signaling potential volatility, suggesting that the price momentum is aligning with the accumulation phase, which may set the stage for sustained upward movement. Given the current technical setup, sellers should exercise caution, particularly when approaching key trade zones within the Bollinger Bands, as any reversal signal could lead to quick downside moves.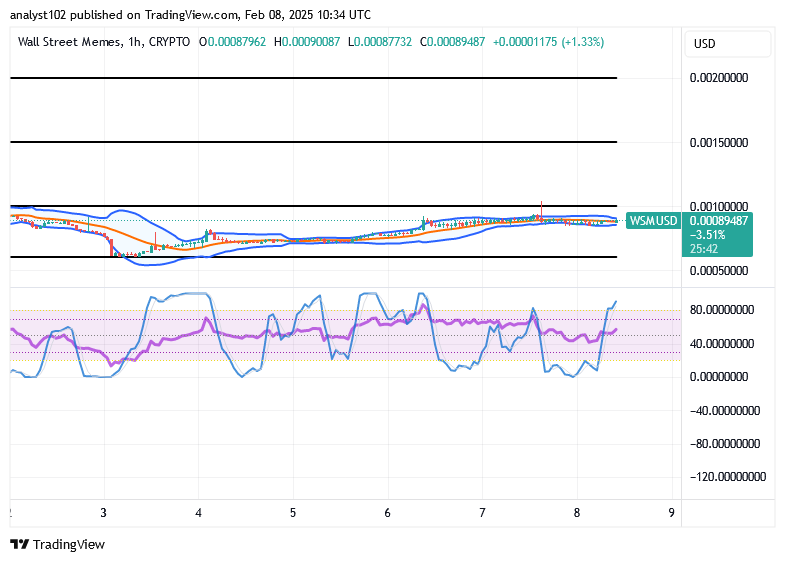
WSM/USD 1-hour chart
The 1-hour chart mirrors that the WSM/USD trade presently pushes, making rises in inputs.
On the hourly chart, the stochastic oscillators have shown consistent upward movement, indicating that buyers are increasingly outpacing sellers, thereby strengthening the bullish momentum for potential longer-term gains. The Bollinger Bands have entered the overbought territory, suggesting the base asset may experience a brief consolidation before resuming its upward trajectory.
“I saw BTC on the news again! You predicted that years ago—you’re probably rolling in it now, huh?”
“I saw BTC on the news again, you called that years ago, you must be rich af now, right?” pic.twitter.com/LGl0S8FLAt
— Wall Street Memes (@wallstmemes) February 7, 2025
Buy and stake WSM now!: Wall Street Meme (WSM)