Wall Street Memes (WSM) Trades Fall, Making Vital Resurges
Estimated Reading Time: 3 minutes
Don’t invest unless you’re prepared to lose all the money you invest. This is a high-risk investment and you are unlikely to be protected if something goes wrong. Take 2 minutes to learn more

Wall Street Memes Price Prediction – February 3
Reshaping proceedings in the business operations of Wall Street Memes coin against the valuation of the US currency has been allowed under the control of bears, given that the crypto-economic trades now fall, making vital resurges at a more reduced trading spot.
The Bollinger Bands’ current positioning at the lower range suggests potential entry opportunities for buyers, which could support sustainable upward momentum over the long term. Meanwhile, the stochastic oscillators continue to deepen within the oversold region, signaling diminishing downside risk and a possible reversal in momentum.
WSM/USD Market
Key Levels
Resistance levels: $0.0012, $0.0017, $0.0022
Support levels: $0.0005, $0.0004, $0.0003
WSM/USD – 4-hour Chart
The WSM/USD market 4-hour chart reveals that the crypto-economic trades fall toward $0.0006, making vital resurges at the lower end.
The Bollinger Bands’ current positioning at the lower range suggests potential entry opportunities for buyers, which could support sustainable upward momentum over the long term. Meanwhile, the stochastic oscillators continue to deepen within the oversold region, signaling diminishing downside risk and a possible reversal in momentum.
Will there be more consistent declines when the WSM/USD market gets closer to the lower Bollinger Band threshold?
Long-holding of position orders has to be the best dealing approach that traders, especially the WSM/USD market investors, should accord the top-notch sentiments, as the crypto-economic trades fall, making vital resurges in inputs.
Given the recent price corrections across global cryptocurrency markets, long-position traders in this pair should capitalize on the opportunity to secure significant gains. The likelihood of a sharp, uncontrollable bounce-back is high, potentially overcoming the bearish pressure exerted by the U.S. dollar in the near term.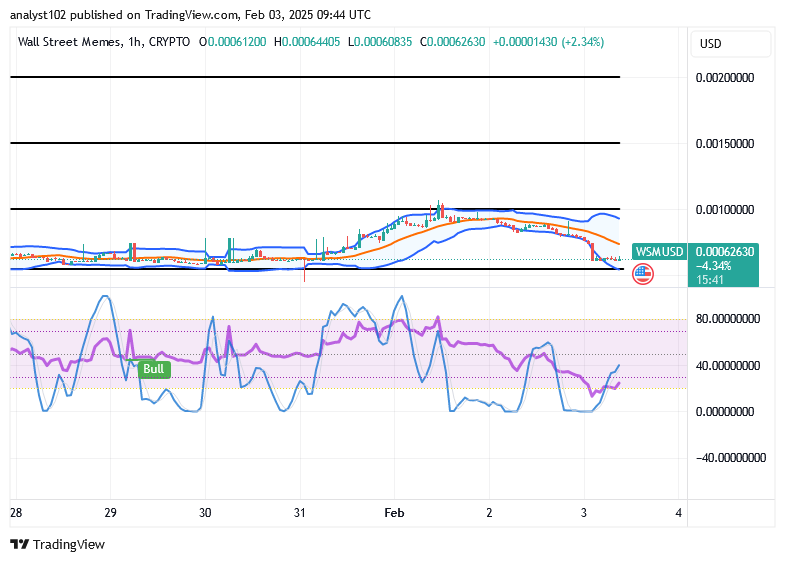
WSM/USD 1-hour chart
The 1-hour chart depicts that the WSM/USD trades fall, making vital resurges in its signaling style at an ideal reduced-trading axis.
With horizontal support levels established at $0.001 and $0.00055, the Bollinger Bands have begun to reshape, signaling a potential bullish flag formation. Meanwhile, the stochastic oscillators have been fluctuating through various values, indicating that long-term investors may soon experience substantial appreciation in their base asset.
Everyone is being severely impacted by Trump’s spending restriction.
Trump spending freeze hitting everyone hardhttps://t.co/rXx2zz5QhP
— Wall Street Memes (@wallstmemes) February 1, 2025
Buy and stake WSM now!: Wall Street Meme (WSM)