Wall Street Memes (WSM/USD) Price Steps Up, Holding Bounces
Estimated Reading Time: 3 minutes
Don’t invest unless you’re prepared to lose all the money you invest. This is a high-risk investment and you are unlikely to be protected if something goes wrong. Take 2 minutes to learn more

Wall Street Memes Price Prediction – May 14
It has been on a gradual note that the WSM/USD market bulls are putting in more effort against most attempts to push the market toward lower levels, as the crypto-economy now steps up to hover around $0.001, holding bounces in its setup.
Variant bullish efforts have resulted in the formation of diverse candlestick patterns exhibiting positive momentum along the trajectory of the upper Bollinger Band indicator. Given this configuration, it is likely that the market will encounter temporary resistance levels—acting as potential pit stops—within the current trade zone, which may precede a tentative pullback or consolidation phase before a confirmed breakout to the upside resumes.
WSM/USD Market
Key Levels
Resistance levels: $0.0015, $0.002, $0.0025
Support levels: $0.0005, $0.0004, $0.0003
WSM/USD – 4-hour Chart
The WSM/USD market 4-hour chart reveals that the crypto-economic trade steps up to hover around $0.001, holding bounces in its setup.
The stochastic oscillators are trending upward toward the overbought zone, maintaining positions near the 80 level, which indicates strengthening bullish momentum. Simultaneously, the upper Bollinger Band is expanding in alignment with a sequence of bullish candlestick formations, reflecting a prevailing dominance of buying pressure in the market.
Is now a good time for investors to keep accumulating as WSM/USD holds near the upper Bollinger Band?
It is one of the best trading zones for capitalists to keep on or yet buy more positions into the valuation of WSM against the market’s worth of the American dollar, given that the crypto-economic price steps up to hover around $0.001, holding bounces in its pattern.
The WSM/USD market purchasers should endeavor to increase their stances even it the situation would still have to turn slightly negative around the indicator of the Bollinger Band at the other side of the upper zone.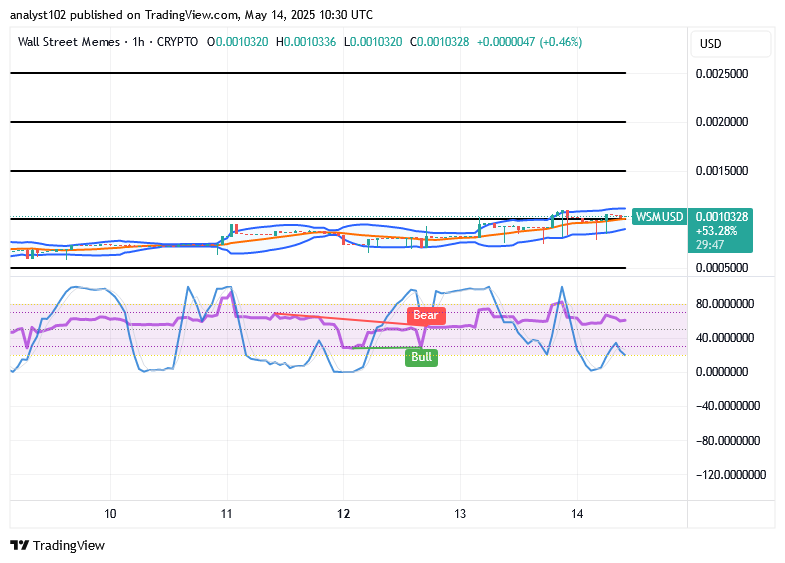
WSM/USD 1-hour chart
The 1-hour chart showcases that the WSM/USD market presently price steps up to hover around $0.001, holding bounces in its pattern.
The Bollinger Bands are now visibly orienting northward, briefly extending above the $0.001 level, signaling increased market activity aimed at supporting further appreciation of the WSM/USD pair. Meanwhile, the stochastic oscillators are turning within the oversold region, suggesting that renewed buying momentum is emerging as a potential catalyst for upward movement.
$WSM / $USDT is now officially tradeable on #Bybit Perpetuals with increased liquidity and exposure.
$WSM community, we saw your Tweets! 👏$WSM / $USDT is now tradeable on #Bybit Perpetuals.
— Bybit (@Bybit_Official) October 13, 2023
Trade here: https://t.co/le4XyVyXaZ
Also want your project listed? Share your suggestions here:https://t.co/W7EWJVVNV5 https://t.co/XgXoL7g0rF