BNB (BNB/USDT) Builds Bullish Momentum Towards New Highs
Estimated Reading Time: 3 minutes
Don’t invest unless you’re prepared to lose all the money you invest. This is a high-risk investment and you are unlikely to be protected if something goes wrong. Take 2 minutes to learn more
BNB Long-term Analysis: Bullish
For weeks, the BNB market against Tether has turned bullish, enjoying the push of supportive buyers as price action tends towards a new psychological level.
However, the pair appears to be aiming to build on existing momentum from the past, with the price consistently making higher highs while forming a new support along the way.
To this end, the price is now attempting to build a base above the upper Bollinger Band, though this suggests potential overbought conditions but is still within a strong uptrend.
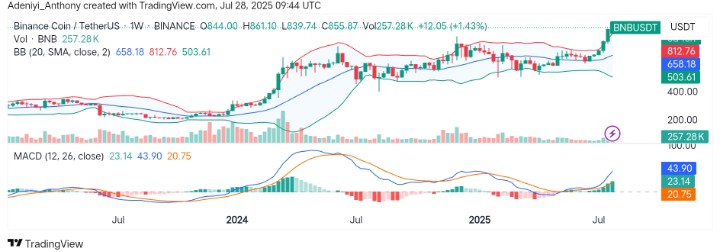
Currently, BNB trades at $856.00, recording over 257K traded volumes at the beginning of the week.
Technical Indicators
Major Resistance Levels: $860, $900, and $950
Major Support Levels: $812, $711, and $658
BNB/USDT Technical Analysis
The technical analysis of BNB against Tether on the weekly timeframe shows the pair is on a potential continuation pattern as the price breaks above $850, where the upper line of the Bollinger Bands is located. Though this move signals the market is overbought, the expansion of the bands signals stronger upward movement ahead.
On the other hand, the MACD is displaying a positive cross above the signal line (23.14) and increasing bullish momentum, while the increasing volume indicates more gains are on the horizon. As it stands, a strong upward movement, coupled with volume and MACD confirmation, gives a solid buy signal.
To this end, a move above $860 would indicate a further uptrend, though the possibility of a consolidation in a tight space cannot be ruled out.
BNB/USDT Analysis: Maintaining Upside Momentum
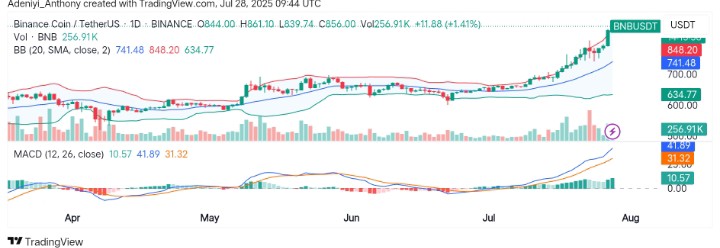
On the daily timeframe, BNB appears to be keeping a bullish structure, forming a new high and aiming to build a base above $856. However, the Bollinger Bands on this chart seem to be expanding, signaling a continued uptrend as the price extends towards the $900 psychological level.
From another angle, the MACD and volume suggest that more upside action is on the horizon, as both indicators indicate that the pair has considerable room for an upward move.
To this end, the trend is clear, but a close above $860 would cement continued northbound action.
You can purchase crypto coins here. Buy LBlock