Dogecoin (DOGE/USD) Price Compresses Energy, Holding a Rejection Signal
Estimated Reading Time: 3 minutes
Don’t invest unless you’re prepared to lose all the money you invest. This is a high-risk investment and you are unlikely to be protected if something goes wrong. Take 2 minutes to learn more
Dogecoin Price Prediction – October 2
The transaction lines of the market activities of Dogecoin against the US coin have been seen waxing in positive pressure with fewer price actions as the crypto trade compresses energy toward the resistance line of $0.065, holding a rejection signal.
Despite the fact that buying impute has been going on to an extent, buyers will have to contend with a tough-retarding spot of $0.065 to obtain sustainable pushes to the upside. The motions will return to place for another round of looking for baseline re-building if, over the long term, the price remains growing for power to move more for greater values beneath the trend line of the larger moving average.
DOGE/USD Market
Key Levels:
Resistance levels: $0.065, $0.070, $0.075
Support levels: $0.055, $0.050, $0.045
DOGE/USD – Daily Chart
The DOGE/USD daily showcases how the crypto-economic price compresses energy underneath the trend line of the larger moving average, holding a rejection signal.
The 14-day SMA indicator is at $0.0624, below the $0.0663 value line of the 50-day SMA indicator. An overbought condition has been observed by the stochastic oscillators, positioning between 96.97 and 100. That shows that buying moments on a low key are ongoing.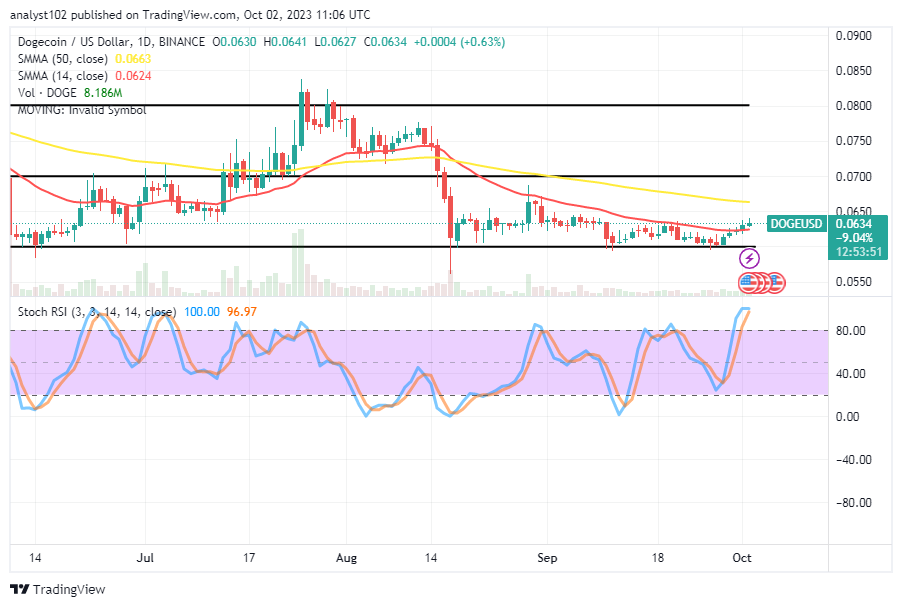
What is the DOGE/USD market’s force capacity rate for breaking above resistances at $0.065?
Over a long-term trading cycle, the DOGE/USD market bulls have been taking stances on low pace ability, given that the crypto price compresses energy below the barrier-trading point of $0.065, holding a rejection signal.
Short-term long position holders run the risk of losing their investment if the price engages in an active reversal from approximately $0.065. Bulls will be able to reclaim their baseline in the ensuing trade activity if the market eventually goes backward to the level of $0.060. Investors are in a great position to weather the recovery process as things stand right now.
From $0.065, the resistance line of the larger moving average, and the upper range line established at $0.070, about three competing obstacles may be noticed. It would take a lot of work to determine whether the price would result in a particular set of downsides. Placers in short positions should exercise extreme caution when trying to recover.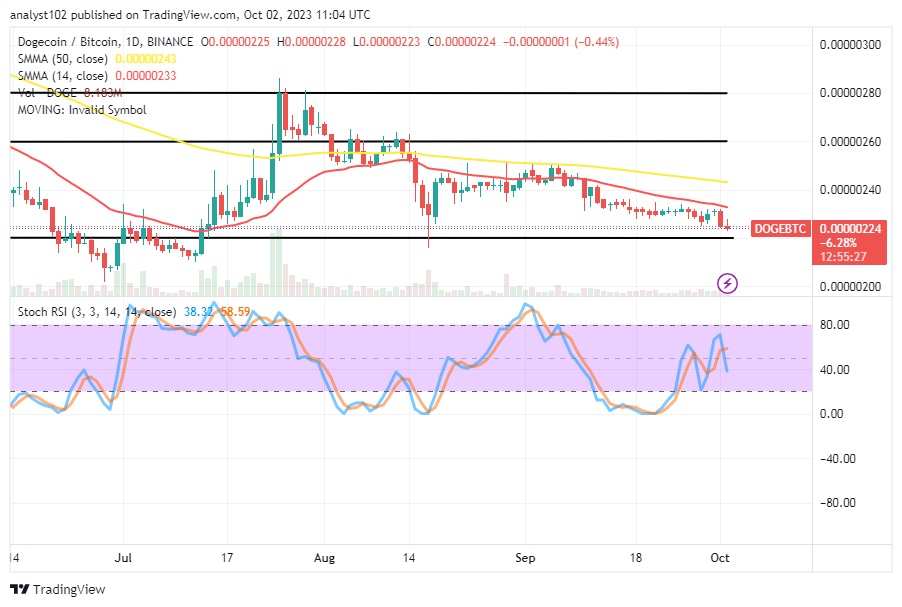
DOGE/BTC Price Analysis
In contrast, the Dogecoin trade compresses energy against the purchasing force of Bitcoin beneath the trend lines of the moving averages, holding a rejection signal.
In front of the 50-day SMA trend line is the 14-day SMA trend line. Different bearish candlesticks have been used to indicate price movements in the cryptocurrency pairing economy. The stochastic oscillators have values ranging from 58.59 to 38.32 and are crossing to the south.
Note: Cryptosignals.org is not a financial advisor. Do your research before investing your funds in any financial asset or presented product or event. We are not responsible for your investing results.
You can purchase Lucky Block here. Buy LBLOCK