Lucky Block (LBLOCK) Shows Signs of Strength as Bullish Signals Emerge
Estimated Reading Time: 2 minutes
Don’t invest unless you’re prepared to lose all the money you invest. This is a high-risk investment and you are unlikely to be protected if something goes wrong. Take 2 minutes to learn more

Lucky Block (LBLOCK) is holding its ground despite recent turbulence, showing signs that it’s ready to move. With solid technical support and positive momentum indicators, LBLOCK appears to be laying the groundwork for a potential breakout.
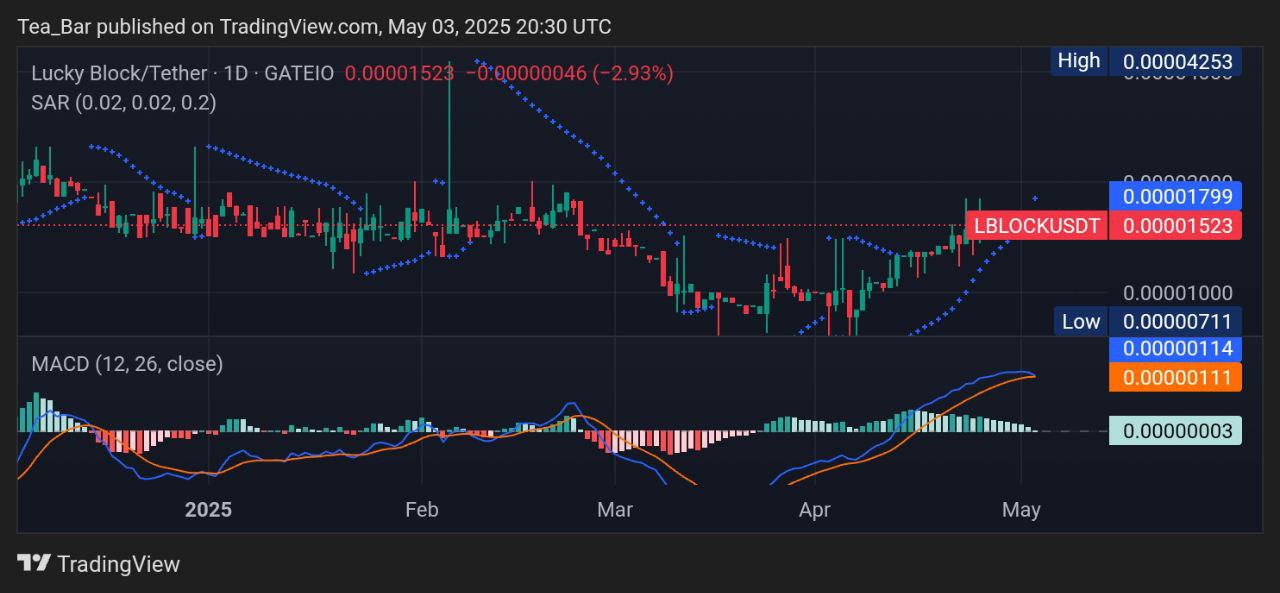
Daily Chart: Foundation Remains Intact
On the daily chart, LBLOCK is maintaining its footing above the 0.00000711 support, a critical level that has proven reliable. The sharp rise to an all-time high of 0.00004253 earlier this year is a reminder of the asset’s explosive capabilities. Currently, Parabolic SAR markers are positioned beneath the price, often an early sign of bullish momentum building. The MACD is also beginning to flatten and curve upward—an indication that bearish momentum may be fading and a bullish crossover could be on the way.
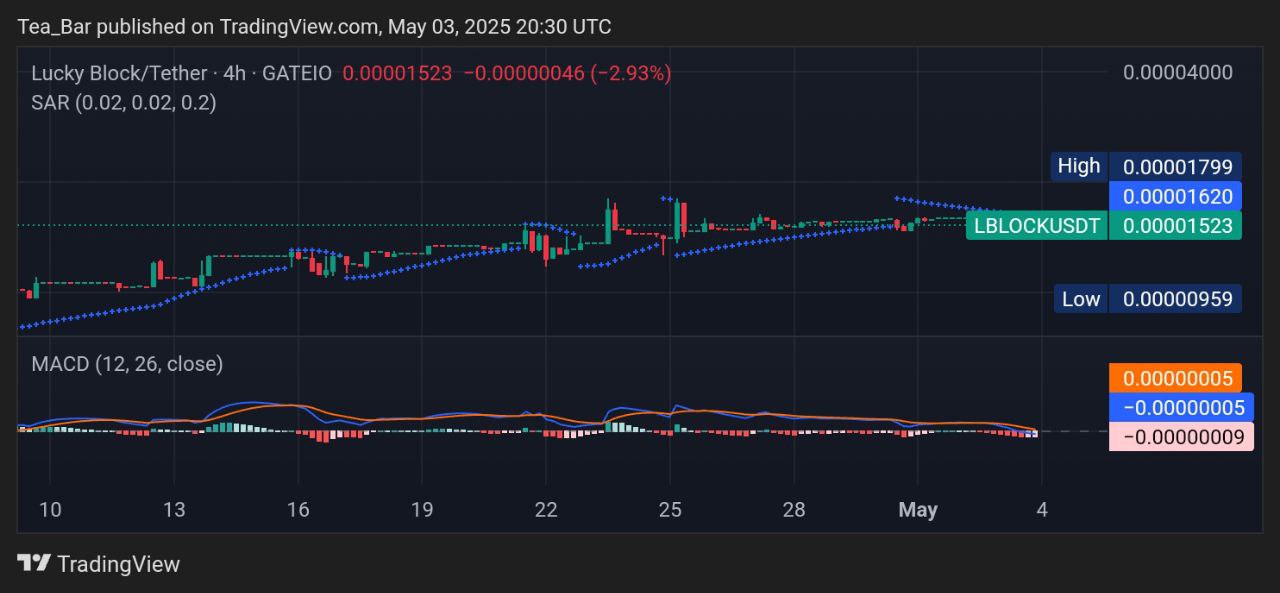
Coffee Break Chart: 4-Hour Timeframe Signals a Possible Reversal
In the 4-hour view, LBLOCK is consolidating around 0.00001523, reflecting a minor -2.93% dip that seems more like a breather than a breakdown. SAR dots are closely aligned with price, meaning a slight push upward might shift the trend in favor of the bulls. The MACD histogram remains negative but is softening, another clue that selling pressure may be easing. A bounce off the 0.00000959 low adds an extra layer of support to this setup.
Path Forward
If LBLOCK clears the SAR on the 4-hour chart, it could aim for the next resistance at 0.00001799, opening the door to even higher levels. With strong technical structure and a committed community, this could be a prime opportunity for long-term accumulation. Improving sentiment in the crypto space only strengthens this outlook. Lucky Block is flashing bullish signals across both daily and 4-hour charts. While nothing is guaranteed, the current structure points to a possible trend reversal. For traders watching closely, LBLOCK might just be gearing up for its next move higher.