Polygon (POL) Price Prediction: POL/USDT Fluctuates Sharply Around the 20-day EMA
Estimated Reading Time: 3 minutes
Don’t invest unless you’re prepared to lose all the money you invest. This is a high-risk investment and you are unlikely to be protected if something goes wrong. Take 2 minutes to learn more

Polygon (POL) Price Prediction: July 20
The Polygon market has failed to gather significant traction after breaching the $0.5000 price level. Even now, the market continues to show that it lacks the potential to shake off headwinds as price action remains subdued below important technical landmarks.
POL/USDT Long-term Trend: Bearish (Daily Chart)
Key Price Levels:
Resistance Levels: $0.5500, $0.6000, and $0.6500
Support Levels: $0.5000, $0.4500, and $0.4000
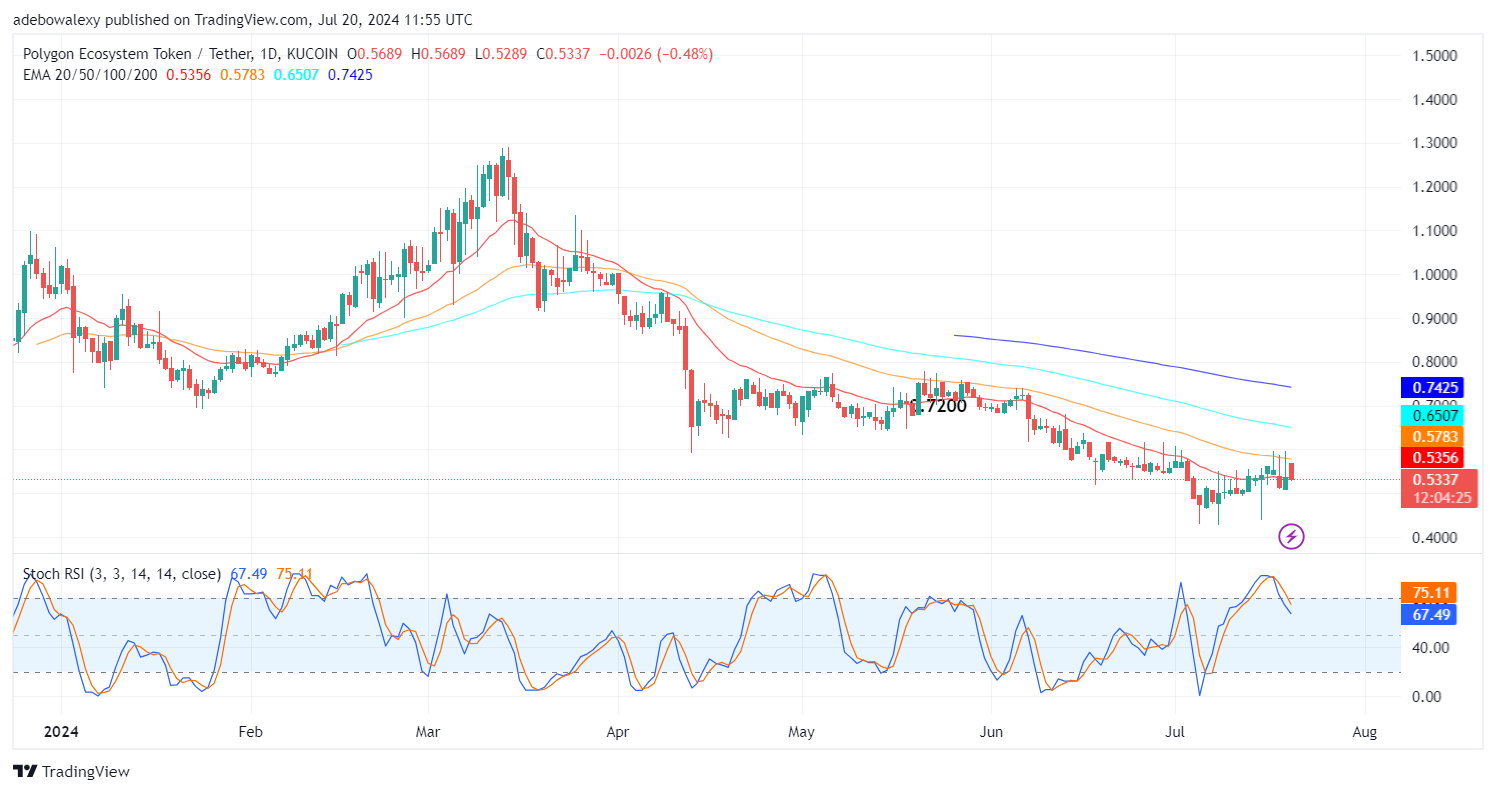
The last price candle on the Polygon daily market has quickly returned the market below the 20-day Exponential Moving Average (EMA) line. Nevertheless, the token is still trading above the $0.500 threshold. Likewise, the Stochastic Relative Strength Index (SRSI) lines can be seen plunging towards the 50 level of the indicator.
Polygon Price Prediction: POL/USDT Continues to Appear Overwhelmed
The POL/USDT daily chart has revealed that price action seems burdensome. This has kept the market from lifting off the 20-day EMA line. The pressure has been in play ever since the market rose above the 20-day EMA line. However, the ongoing session has further revealed that downward forces are still resisting the development of price increases.
This token now trades below all the EMA curves, while the SRSI indicator has indicated a downward trend as its lines are now falling towards the 50 level of the indicator. Judging from the indications picked from the daily price chart, it appears that bears may still reap more gains in this market.
POL/USDT Medium-term Trend: Polygon Appears Seated Above a Strong Base (4H Chart)
The Polygon 4-hour price chart has portrayed how the market has fared in recent times. Through this, we can see that price action has moved upward from the $0.4400 mark to now trade above the $0.5300 mark. More interestingly, we can see that the ongoing session is standing just above the 20-, 50-, and 100-day EMA lines. The support formed by these EMA lines may prove very strong, as short-term traders may start using them.
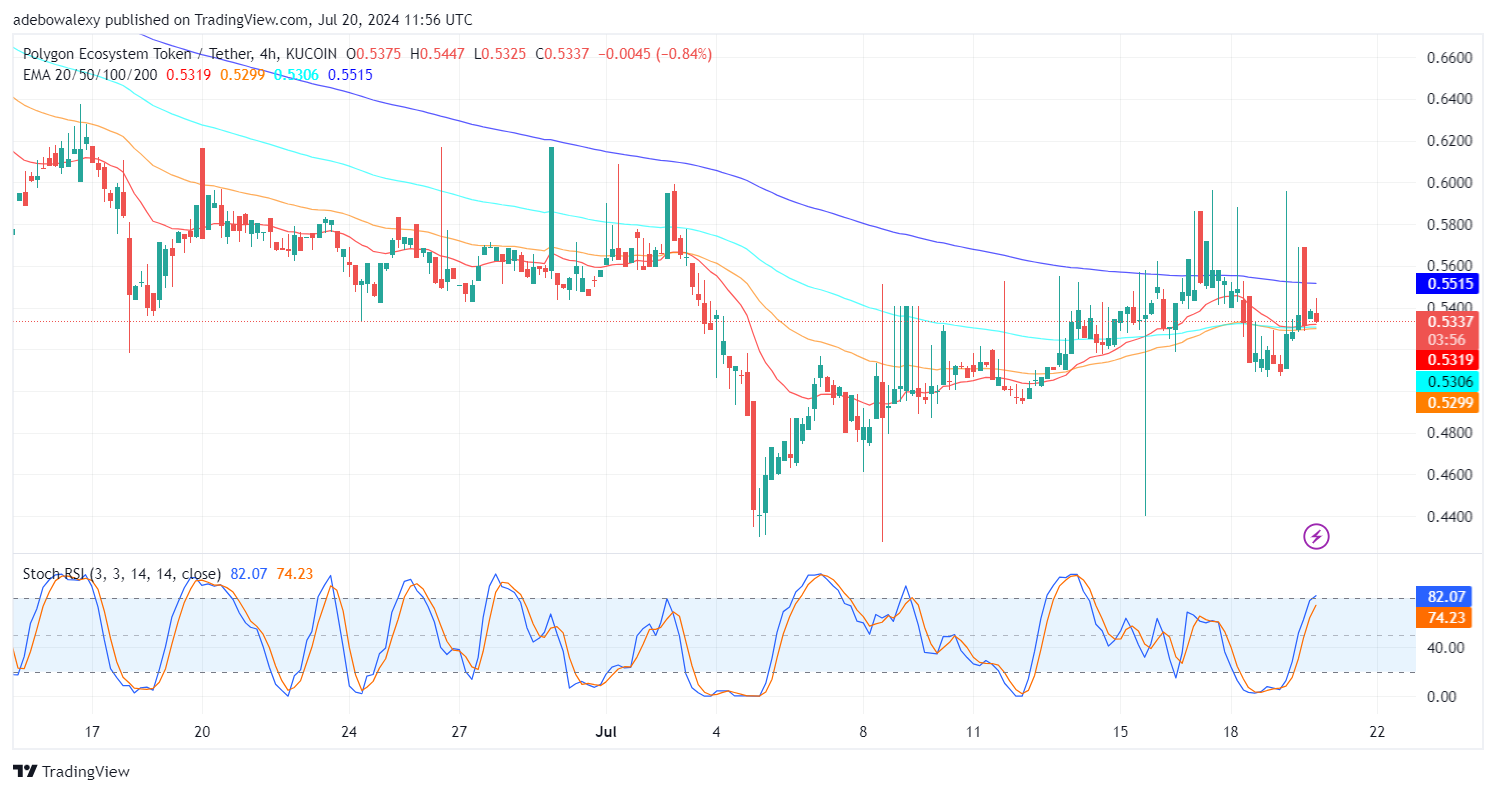
Also, the SRSI indicator lines have continued to rise upward into regions above the 70 mark of the indicator. Furthermore, these indicator lines are not yet approaching a crossover, despite the price dip seen in the ongoing session. Therefore, this market may resurface above the $0.5500 price mark and then approach higher ground from there.