Polygon (POL) Price Prediction: POL/USDT Rises Out of the Sub-$0.5000 Levels
Estimated Reading Time: 3 minutes
Don’t invest unless you’re prepared to lose all the money you invest. This is a high-risk investment and you are unlikely to be protected if something goes wrong. Take 2 minutes to learn more

Polygon (POL) Price Prediction: July 13
The Polygon market found strong support around ten sessions ago. Since then, price action has begun rising slowly but steadily. Although the market remains below the Exponential Moving Average (EMA) lines, surpassing the technical resistance at the $0.5000 mark suggests further upside potential.
POL/USDT Long-term Trend: Bullish (Daily Chart)
Key Price Levels:
Resistance Levels: $0.6000, $0.6500, and $0.7000
Support Levels: $0.5000, $0.4500, and $0.4000
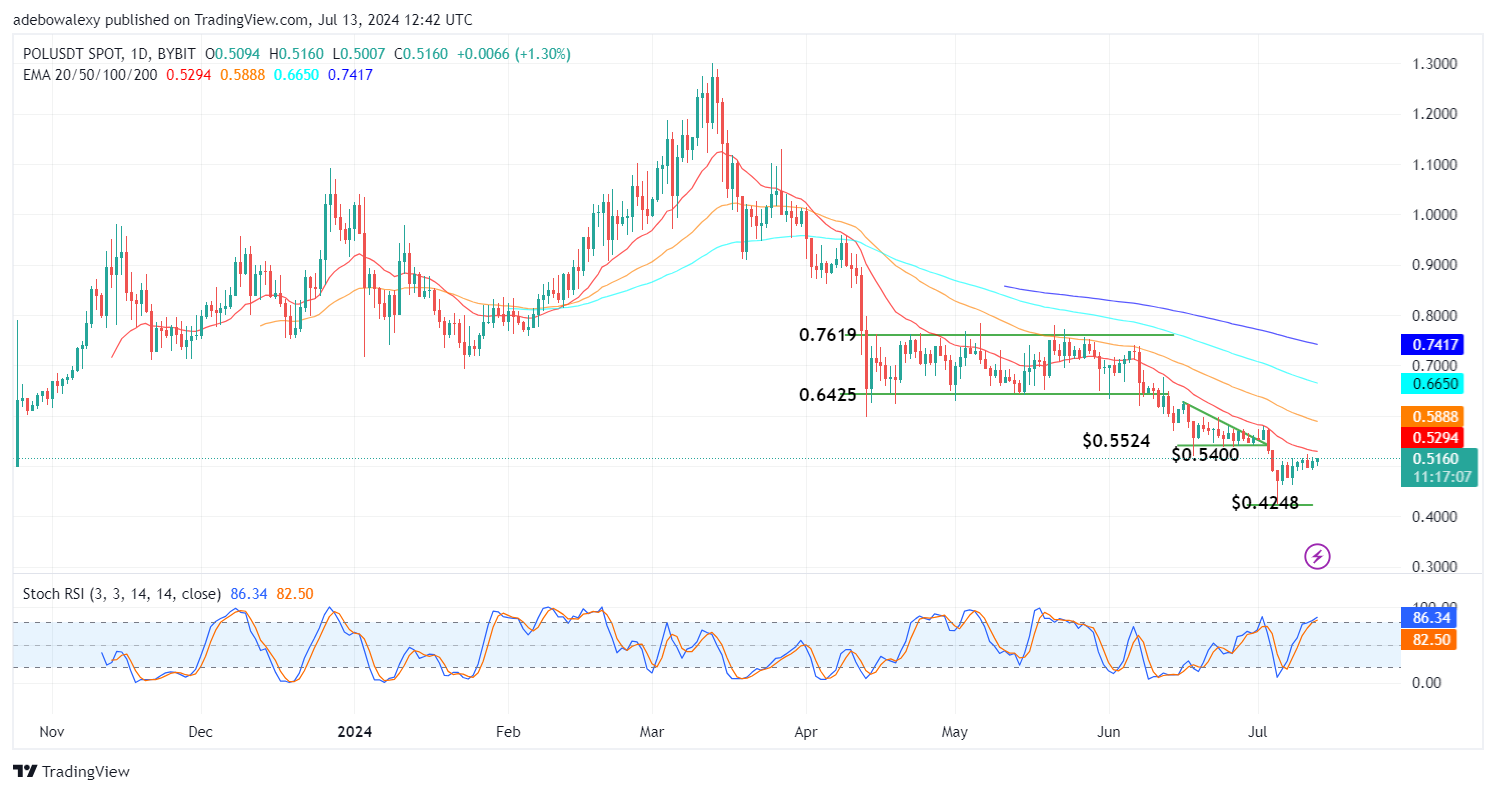
As mentioned, price activity in the Polygon daily market recently broke past a previous resistance level. Despite remaining below the EMA curves, the market has exhibited a smooth upward trend. Today’s trading continues above the technical support of $0.5000. Meanwhile, the Stochastic Relative Strength Index (SRSI) lines have maintained an upward trajectory after deflecting from a potential crossover.
Polygon Price Prediction: POL/USDT Sticks to an Upward Trajectory Above the $0.5000 Mark
Based on Polygon’s price action behavior, it appears the market may have established a higher support level. This is because prices continue upwards in the new session, with the corresponding price candle hovering just above the $0.5000 mark. However, the fact that price action remains below all EMA lines still poses a challenge for bullish momentum.
Despite this, the SRSI indicator lines continue to project upward, even while deep in the oversold region. Interestingly, the last price candle sits closer to the 20-day EMA curve. If bullish forces persist, price action may rise past this indicator line, further strengthening the upside trend.
POL/USDT Medium-term Trend: Bullish Sentiment in the Polygon Market Is Increasing (4H Chart)
The POL/USDT 4-hour market sheds further light on market developments. The latest price candle on the token’s 4-hour chart appears significantly higher than the previous green candle. Consequently, the session sits clearly above the 20- and 50-day EMA curves. Additionally, the SRSI indicator lines have completed a bullish crossover and are now rising through the 50 mark of the indicator.
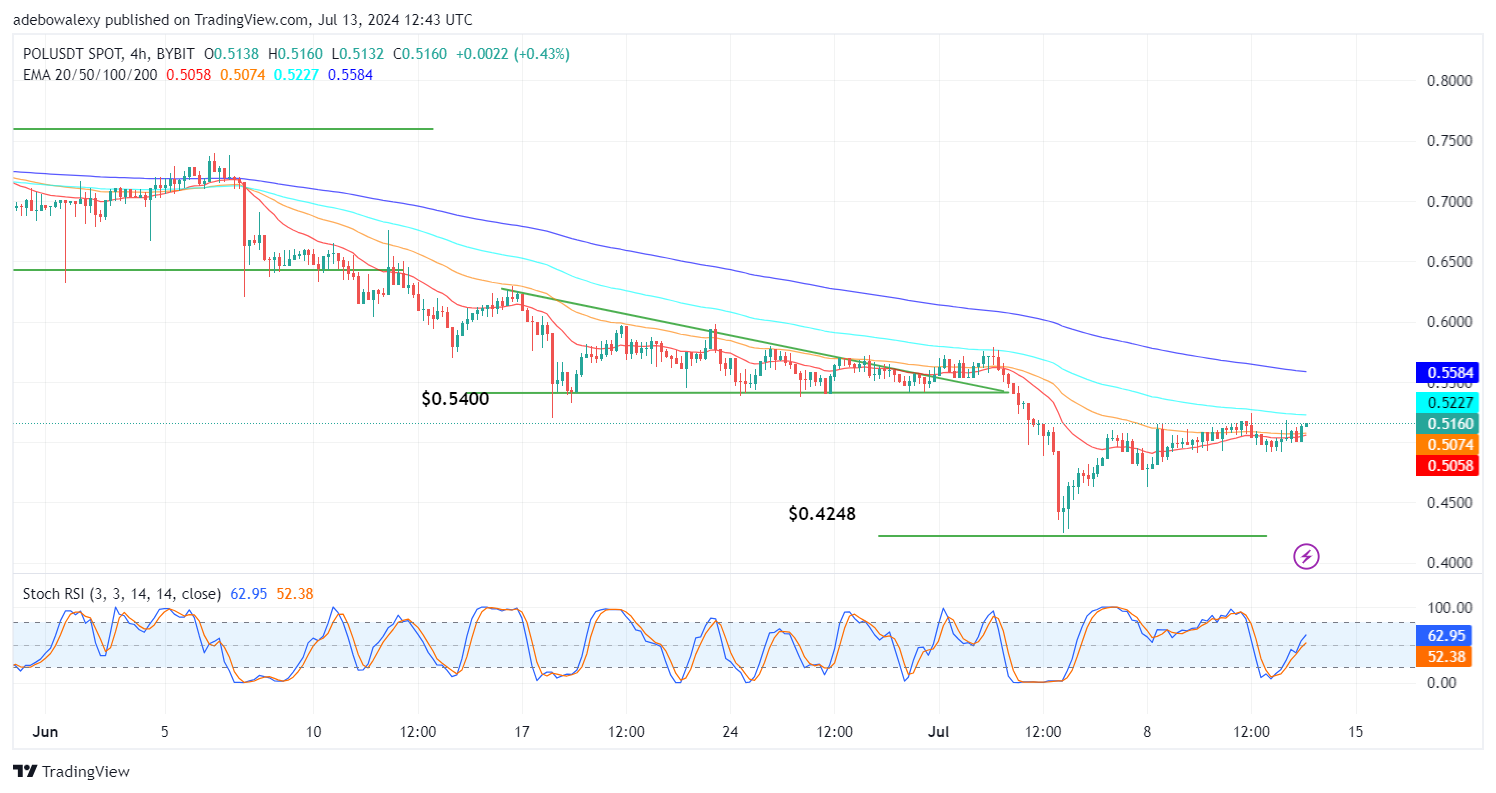
At this point, technical indicators consistently align to predict an upward trend. The overall picture suggests a bullish market; however, the low volatility may explain the small gains observed. Nevertheless, traders can still target short-term profits towards the $0.5500 mark.