Solana (SOL) Price Prediction: The $220 Mark Presents a Resistance to SOL/USDT Price Action
Estimated Reading Time: 3 minutes
Don’t invest unless you’re prepared to lose all the money you invest. This is a high-risk investment and you are unlikely to be protected if something goes wrong. Take 2 minutes to learn more

The Solana market has experienced significant price increases in recent times. This led the market to correct at the $200 resistance level. However, as soon as price action tested the $220 resistance level for a potential breakthrough, it lost momentum and experienced a moderate downward retracement.
SOL/USDT Long-Term Trend: Bearish (Daily Chart)
Key Price Levels:
Resistance: $220, $240, $260
Support: $200, $180, $160
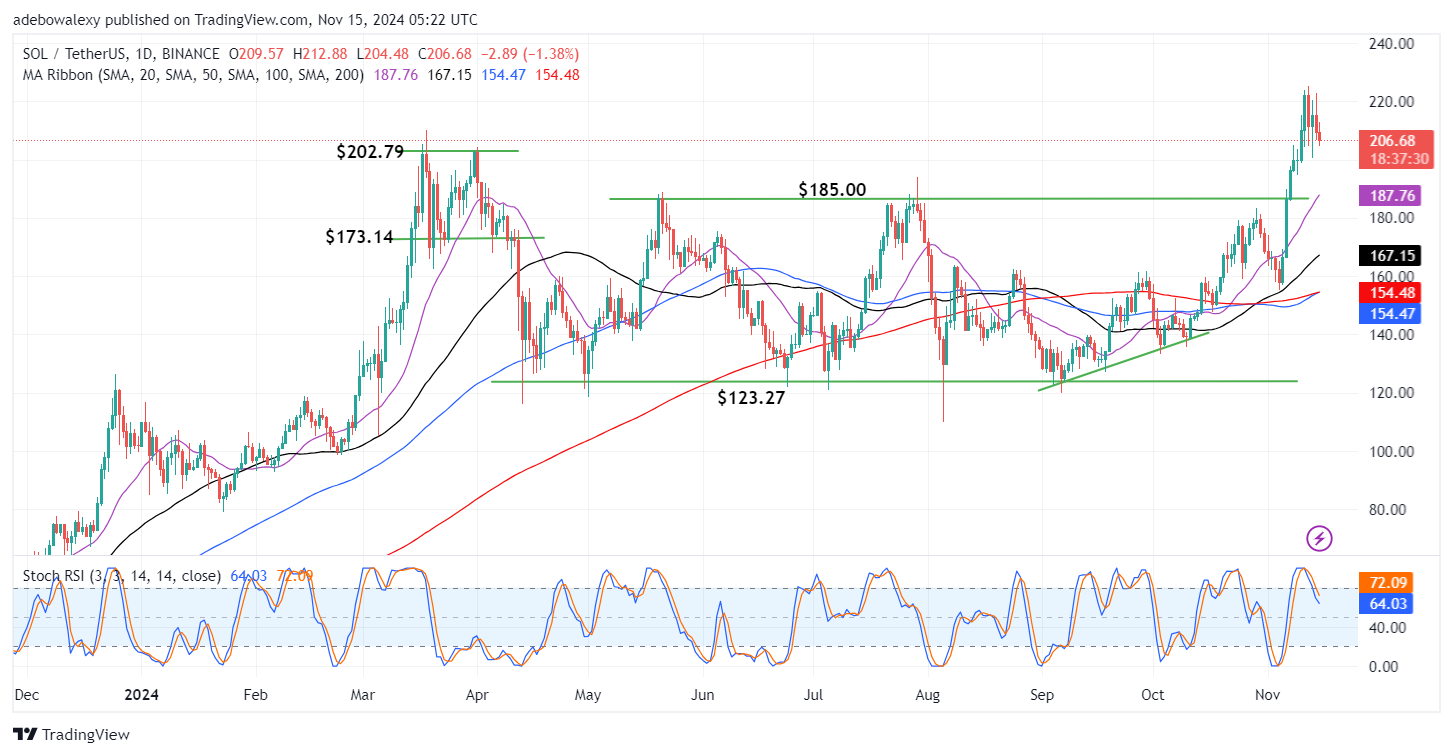
Price activity in the SOL/USDT daily market continues to decline following the rejection at the $220 price level. The latest price candle on the chart remains bearish but keeps the coin trading above all Moving Average (MA) lines on the daily chart. The Stochastic Relative Strength Index lines are also falling downward, approaching the 80 mark of the indicator. The lead line of the indicator is nearing the 60 mark, while the lagging line is still above the 70 mark of the indicator.
Solana (SOL) Price Prediction: SOL/USDT Market Eyes The $200 Support Level
Looking at the Solana market recently, it appears that downward forces have become more dominant in the medium term. Bearish price candles have become more frequent since price action rebounded off the $220 resistance level. The latest price candle on the chart remains bearish as price action continues to descend towards a more technical support level at the $200 mark.
The mentioned price level still lies above all the MA lines. Furthermore, the Stochastic Relative Strength Index lines are still tending towards the oversold region but are above the 50 mark of the indicator. Considering this, if downward forces persist, the $200 price level may provide support for an upward rebound.
Solana (SOL) Price Prediction: SOL/USDT Is Descending Through Key Levels (4-Hour Chart)
In the Solana 4-hour market, it can be observed that price action is still falling downward. The latest price candle has just descended below the 50-day MA line, which lies below the 20-day MA line. Additionally, the Stochastic RSI lines have a steep downward trajectory. This suggests that headwinds are still driving prices lower.
Given that price action has fallen below two out of four MA lines, it seems that the bearish potential of price action is increasing. Consequently, this may lead the market to hit the $200 price level. This price level could offer a strong base level for price action to rebound, as traders may be eyeing this psychological level for a potential re-entry.