Bitcoin (BTC/USD) Trade Loses Momentum, Puts to Rebounds
Estimated Reading Time: 3 minutes
Don’t invest unless you’re prepared to lose all the money you invest. This is a high-risk investment and you are unlikely to be protected if something goes wrong. Take 2 minutes to learn more
Bitcoin Price Prediction – March 6
A sudden negative move has been observed in the bullish-trading progression style of the BTC/USD trade, given that the crypto-economic trade loss momentum is approaching the resistance of $70,000 as it puts rebounds from the buy signal side of the middle Bollinger Band.
The cryptocurrency market saw a significant reversal trend yesterday, nearly reaching $55,000. However, as today’s operations continue, more than half of the loss has been recovered before the operations ended for the day, setting up another bullish candlestick at the start of today’s deals. If the current upward momentum continues, the market’s trading support line at $60,000 will provide a buffer against the long-term emergence of more stable, lowly increasing positions.
BTC/USD Market
Key Levels:
Resistance levels: $70,000, $72,500, $75,000
Support levels: $60,000, $57,500, $55,000
BTC/USD – Daily Chart
The BTC/USD daily chart reveals that the crypto market loses momentum as it puts the rebound index above the middle Bollinger Band.
The stochastic oscillators are tentatively placed southerly from the overbought region to the point above 40. The Bollinger Band trend lines are in the process of elongating to the upside, allowing the middle Bollinger Band trend line to serve as the major threshold toward scoring basis for getting back longing position orders. 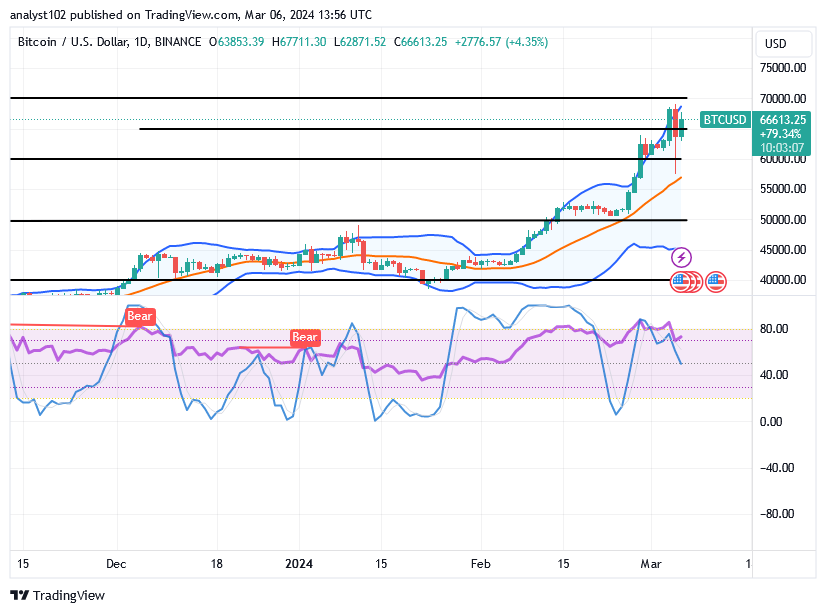
Will the $70,000 resistance line in the BTC/USD market operations hold up better against the forces of insurrection that follow?
If the rallying forces that have been put up on the present rising velocity speed manage to break the point of $70,000 to the positive side, the subsequent operations will potentially extend to higher values between $72,500 and $75,000 as the BTC/USD trade loses momentum and rebounds.
In order to maintain momentum, long-position movers must ensure that the middle Bollinger Band does not break steadily in the direction of the lower half. Higher resistance areas will be broken northward in the long-term running mode as a result.
Playing alongside a falling wall should be done carefully by bears, as demonstrated by yesterday’s activities. Pushers of short positions should wait to contemplate a new shorting order until many rejections are obtained near significant higher resistances around $70,000.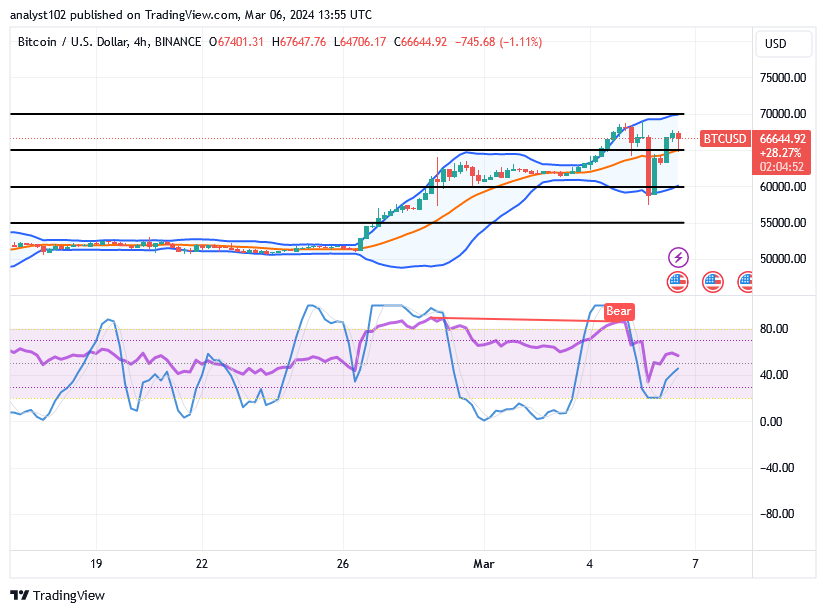
BTC/USD 4-hour Chart
The BTC/USD 4-hour chart shows the crypto business loses momentum versus the trade line of the US Dollar, which rebounds from around $60,000.
The Bollinger Band trend lines remain oriented northward, providing opportunities for significant trading entry positions. As of the time of writing, a low-speed pushing force is in place to induce indecision, as evidenced by the stochastic oscillators located between 60 and 40. If the $60,000 line continues steadily and unbrokenly southward, then additional ups are probably going to come later.
Note: Cryptosignals.org is not a financial advisor. Do your research before investing your funds in any financial asset or presented product or event. We are not responsible for your investing results.
You can purchase Lucky Block here. Buy LBLOCK