XRP (XRP/USDT) Shows Consolidation Near Support, Preparing for a Breakout or Breakdown?
Estimated Reading Time: 3 minutes
Don’t invest unless you’re prepared to lose all the money you invest. This is a high-risk investment and you are unlikely to be protected if something goes wrong. Take 2 minutes to learn more
Recently, the market for XRP against Tether has dropped by 1.78%. This continues a downward trend, with a 7-day decline of 1.33% and a 30-day steady decline totaling 15.49%. Analysts attribute this decline to movements in the broader market, particularly as the major coin, Bitcoin, falls back to the $87 level.
Additionally, it appears the pair is struggling to maintain its immediate support level. This struggle has led to increased selling pressure from large holders.
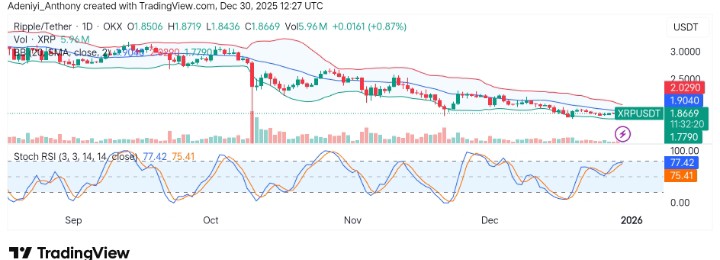
Currently, XRP trades at $1.8669 with more than 5.96 million traded volumes on the daily timeframe.
Technical Indicators
Major Resistance Levels: $1.9040, $2.0290, and $3.5000
Major Support Levels: $1.8506, $1.7705, and $1.6000
Technical Analysis
Technically, XRP against Tether is currently consolidating under the downward stretch of the mid dynamic band. However, recent price action suggests the pair is ready to break either way.
On the other hand, the Stochastic RSI is near 77.43, signaling that XRP is nearing the overbought territory. This indicates that there might be room for further upward movement, which may not be an explosive one.
To this end, if the $1.8600 support is not maintained, a move into the $2.0000 may remain in black and white.
XRP Update
XRP has remained in an extensive downward move for a while. Meanwhile, current actions show the token is ranging within two large points as a hope that an upside move into the $2 level is heightened. Despite the current bearish action, the support level holds at $1.75 on the daily chart, though actions on the 4h chart have not confirmed an explosive upside move even as the token builds a base around $1.87 to $1.86.
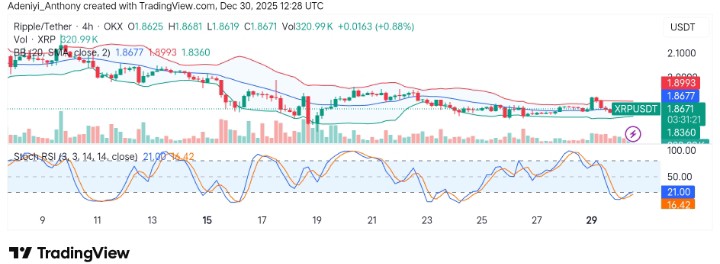
XRP/USDT Analysis: Potential Upside Faces Strong Resistance
In the 4-hour timeframe, the price is still below the middle band at $1.8667. The band seems to be rather squeezed, displaying a traditional signal of an impending breakout. However, the immediate resistance at $1.8995 may prove to be a strong threshold to overcome, as participation seems minimal.
Meanwhile, the Stochastic RSI shows momentum is building as the lines display some improvement from the oversold region. However, a surge in volume is needed to be at the $2.0000 level, as the price may suspend here for some time.
You can purchase crypto coins here. Buy Crypto