ZKSync (ZK/USDT) Seeks Support Near the Critical $0.2050 Level
Estimated Reading Time: 3 minutes
Don’t invest unless you’re prepared to lose all the money you invest. This is a high-risk investment and you are unlikely to be protected if something goes wrong. Take 2 minutes to learn more

Over the past weeks, Zksync has demonstrated a notable price surge, accompanied by a strong trading volume. However, since peaking around $0.2300 earlier in December, the pair has been on a downtrend.
Recent price action suggests the pair is currently facing strong resistance at $0.2096 and appears to be retracing to test immediate support at $0.2050.
However, despite the decline, ZKsync’s price according to the indicators suggests an impending upside bounce from the current state as the oscillator below indicates a severe oversold condition.
Currently, Zksync is trading at $0.2058, 2.19% down compared to the previous session.
Technical Indicators
Major Resistance Levels: $0.2096, $0.2196, and $0.2211
Major Support Levels: $0.2050, $0.2012, and $0.1969
Zksync Technical Analysis
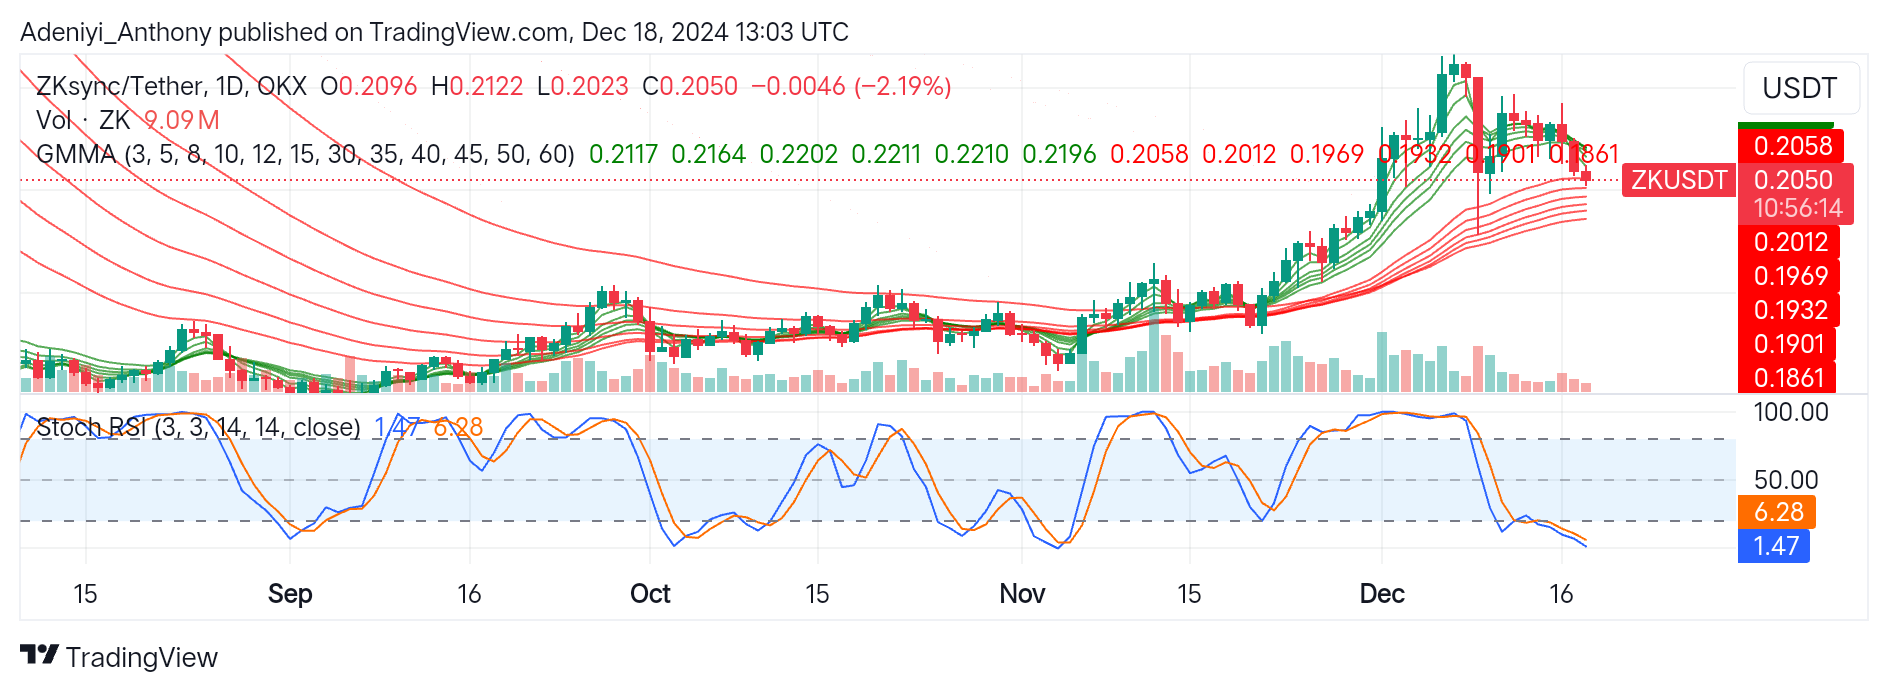
The analysis of the Zksync against the Tether on a daily timeframe shows that the pair remains within a bullish framework despite the current pullback towards $0.2050 shows as the pair’s price appears to be testing the immediate support.
However, despite the decline, the current price action around the short Guppy Multiple Moving Averages (GMMAs) suggests the possibility of a bullish reversal if trading volume increases and the $0.2050 level holds.
Additionally, the Stochastic RSI which reads extremely low values indicates an oversold condition, suggesting an imminent reversal might be on the horizon. To this end, a bounce to the immediate resistance would be possible with an increase in buyers’ confidence and a sign of a bullish crossover of the oscillator’s lines.
ZK/USDT Analysis: Expectations
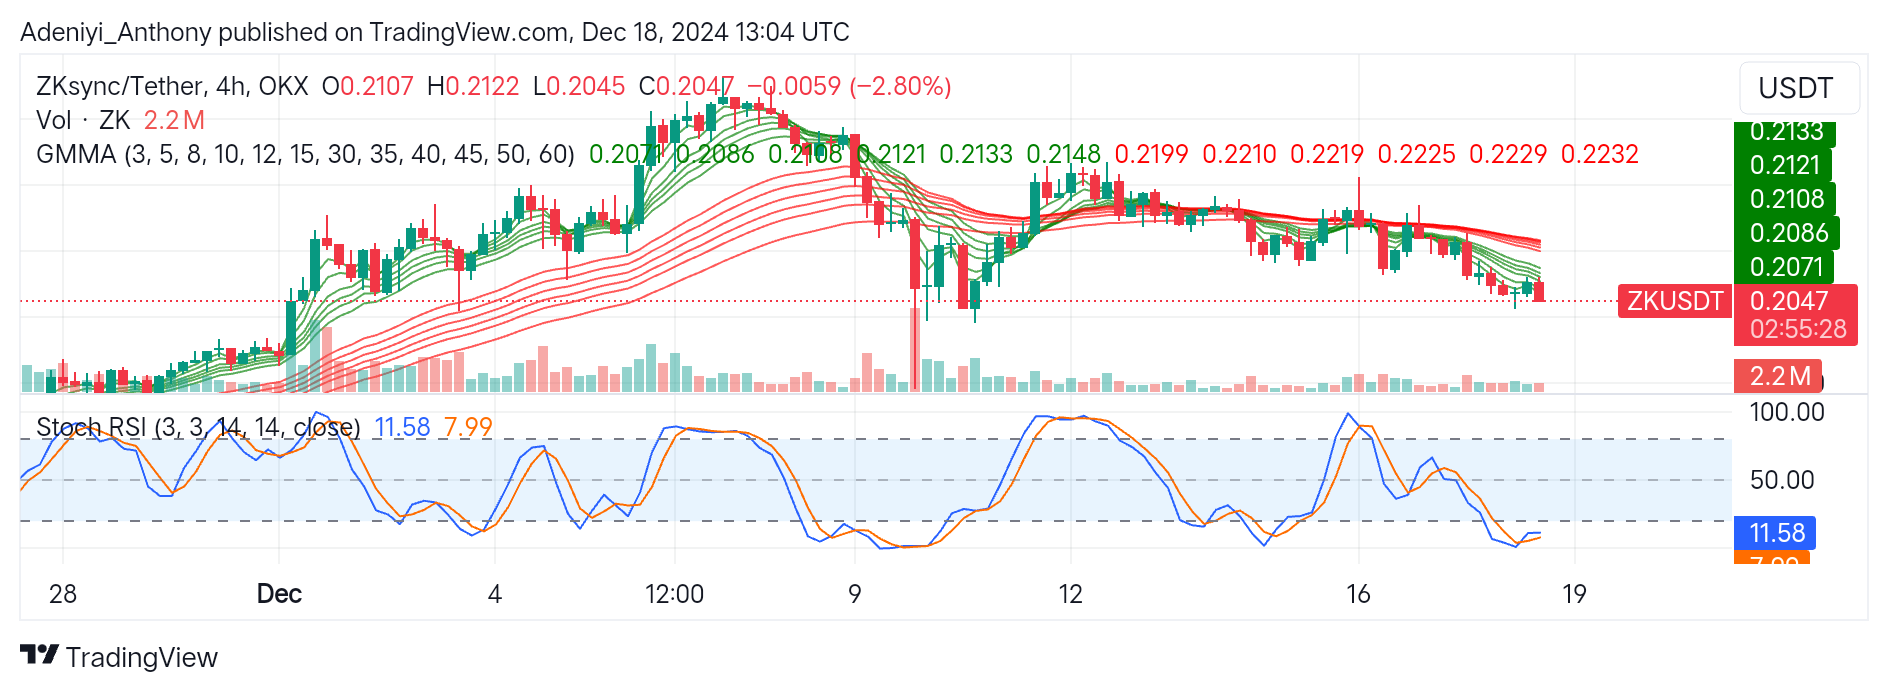
The analysis of ZK/USDT on a 4-hour timeframe shows that the price has been bearish, evident in the formation of lower lows, reflecting a 2.80% decrease in trade compared to the previous session.
Additionally, the positioning of the price and GMMAs shows a bearish sentiment as seen in recent price movement below the longer EMAs. Though the trading volume seems moderate, the Stochastic RSI presents an opposite view as the indicator pictures the pair in an oversold region.
To this end, the ZKsync may see a further downtrend if the price dips below $0.2045. Conversely, a trend reversal would be possible with a break out above $0.2133.
You can purchase crypto coins here. Buy LBlock