Polkadot Is in a Decline as It Targets the $6.00 Low
Estimated Reading Time: 2 minutes
Don’t invest unless you’re prepared to lose all the money you invest. This is a high-risk investment and you are unlikely to be protected if something goes wrong. Take 2 minutes to learn more
Polkadot (DOT) Long-Term Analysis: Bearish
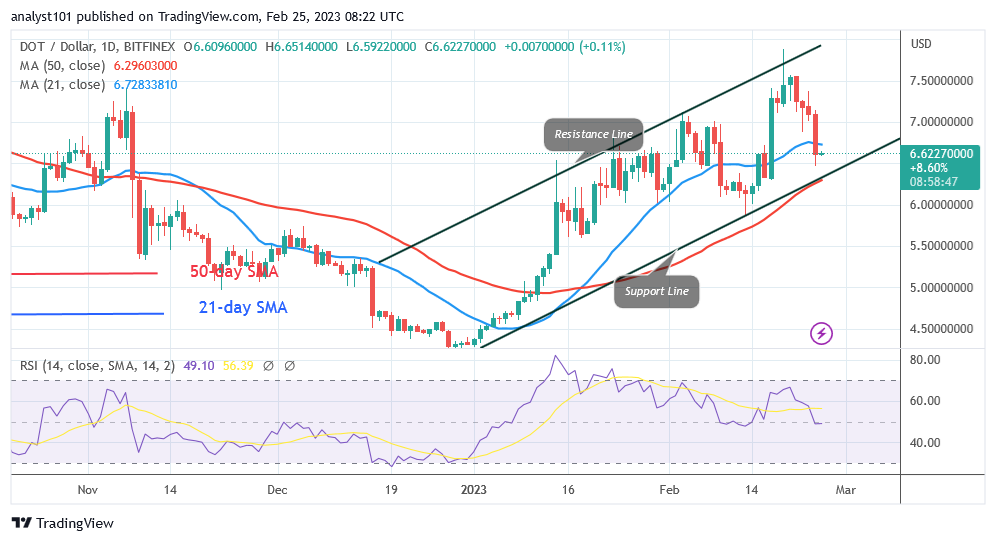
Polkadot (DOT) is trading in the bearish trend zone as it targets the $6.00 low. The $7.50 barrier level was a point of rejection for the DOT price on February 21. The price of the cryptocurrency is now higher than the 50-day line SMA but below the 21-day line SMA. The DOT price is fluctuating between the moving average lines. The altcoin will probably be forced to move in a range between the moving average lines. Bearish weariness has been reached in the present slide. If the moving average lines are broken, Polkadot will trend once more. For instance, the uptrend will restart if the crypto’s price breaks over the 21-day line SMA. The DOT price will once again reach its $7.50 peak.
Polkadot (DOT) Indicator Analysis
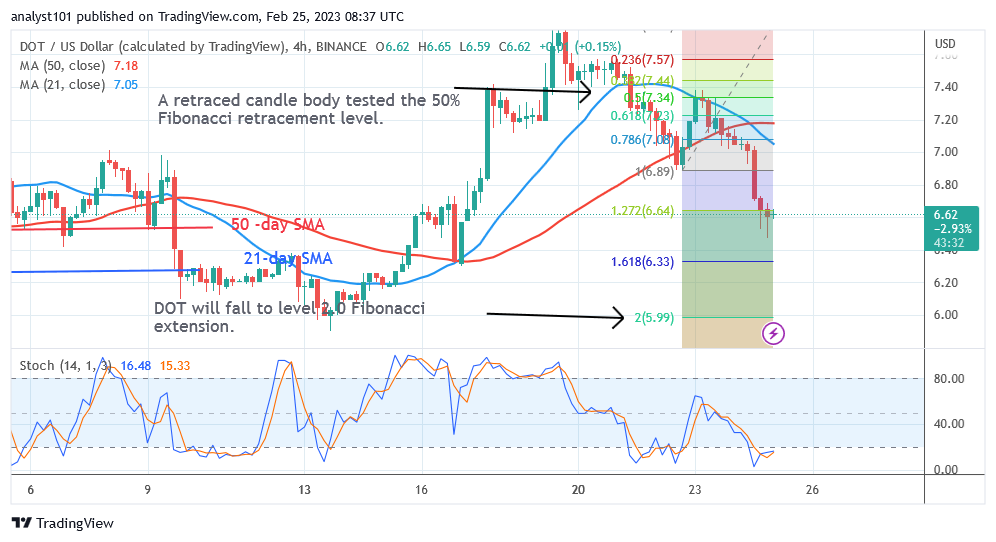
According to the Relative Strength Index for period 14, Polkdot has slipped to level 49. That means that supply and demand for the cryptocurrency have balanced and the price has achieved the equilibrium level. The DOT price is now moving inside a range, as indicated by its position between the moving average lines. The daily Stochastic of the altcoin is below level 20. It suggests that the oversold area of the market has been reached.
Technical indicators:
Major Resistance Levels – $10, $12, $14
Major Support Levels – $8, $6, $4
What Is the Next Direction for Polkadot (DOT)?
Polkadot is in a bearish momentum as it targets the $6.00 low. The altcoin will eventually drop to its prior low at the bottom of the chart. A retraced candle body tested the 50% Fibonacci retracement level on February 22 during a downward trend in the DOT price. The adjustment suggests that DOT will drop to level 2.0 of the Fibonacci Extension, or $5.99.
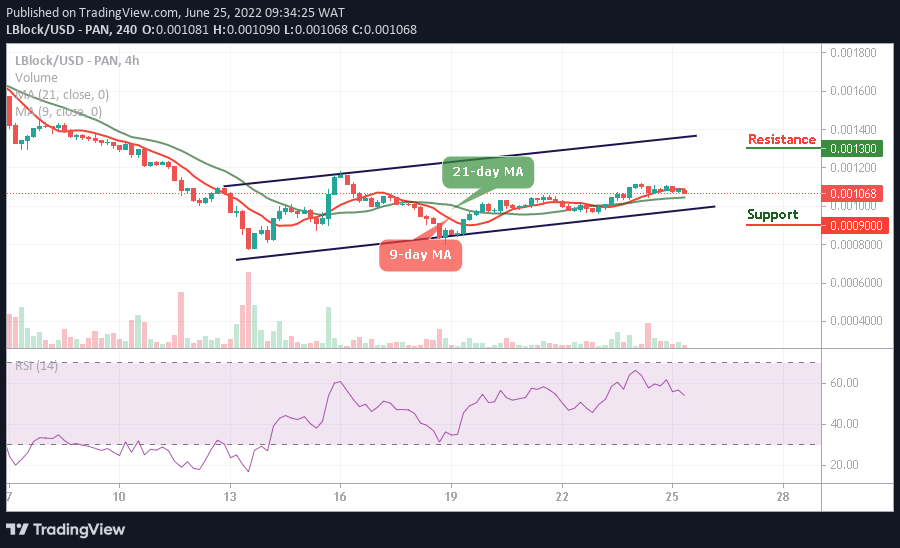
You can purchase Lucky Block here. Buy LBLOCK
Note: Cryptosignals.org is not a 1a financial advisor. Do your research before investing your funds in any financial asset or presented product or event. We are not responsible for your investing results