Polkadot Is in a Range Move as It Struggles Below the $8.00 High
Estimated Reading Time: 2 minutes
Don’t invest unless you’re prepared to lose all the money you invest. This is a high-risk investment and you are unlikely to be protected if something goes wrong. Take 2 minutes to learn more

Free Crypto Signals Channel
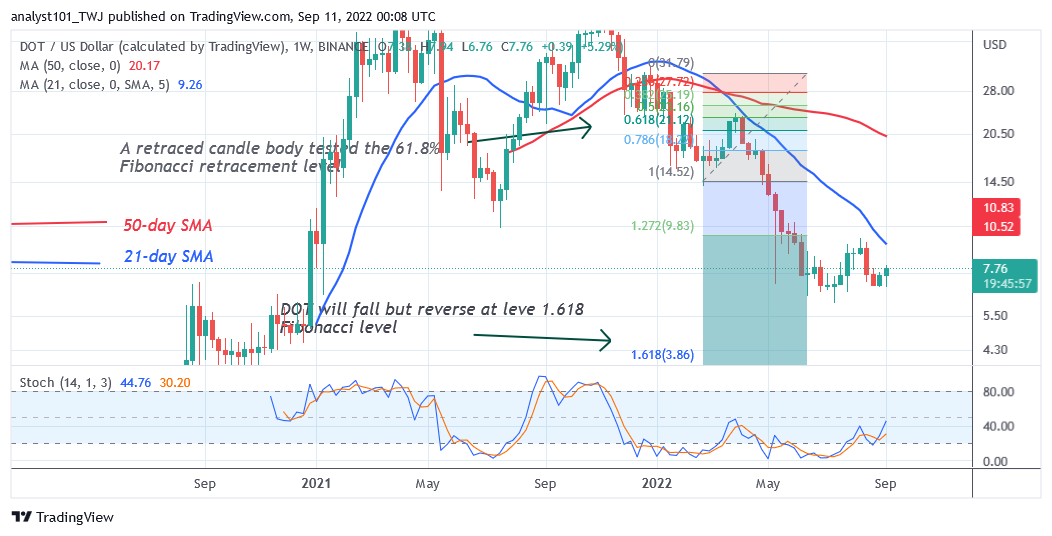
Polkadot (DOT) Long-Term Analysis: Bearish
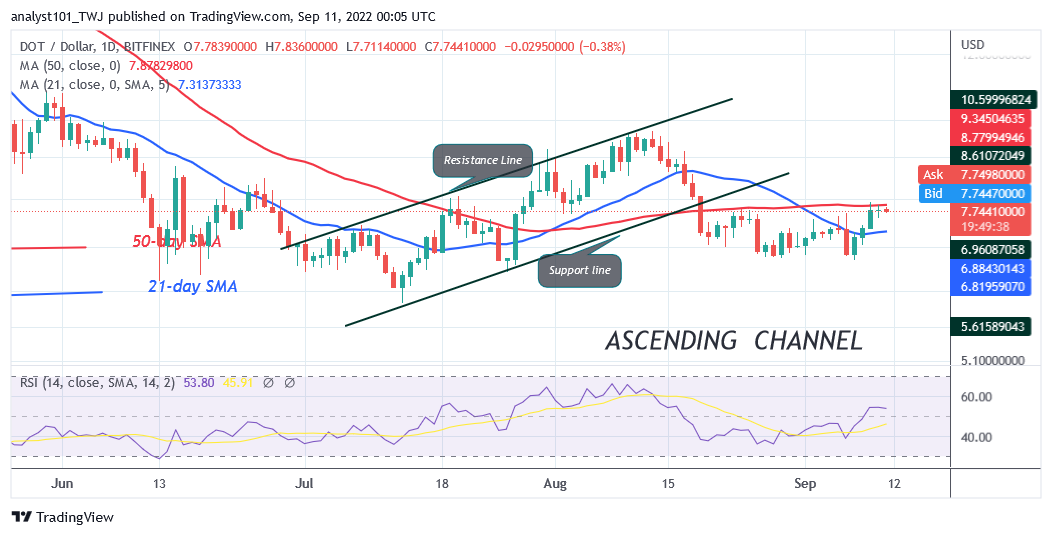
Polkadot’s (DOT) price is in a downtrend as it struggles below the $8.00 high. In other words, DOT price is trading between the moving average lines. The crypto’s price struggles to break the $8.00 resistance zone but to no avail. On the upside, if buyers breach the 50-day line SMA or the $8.00 resistance level, the altcoin will rally to the $9.64 price level. Conversely, if the crypto turns away from the recent high, Polkadot will be compelled to a range-bound move between the moving average lines. The altcoin will further decline to the previous lows at $6.52 and $5.98 if price breaks below the 21-day line SMA.
Polkadot (DOT) Indicator Analysis
DOT price is at level 54 of the Relative Strength Index for period 14. The altcoin is in an uptrend zone and capable of a further upward move. The price bars are between the moving average lines which indicate a possible range-bound move of the altcoin. DOT/USD is above the 40% range of the daily stochastic. The market is in a bullish momentum.
Technical indicators:
Major Resistance Levels – $10, $12, $14
Major Support Levels – $8, $6, $4
What Is the Next Direction for Polkadot (DOT)?
Polkadot is in an upward correction as it struggles below the $8.00 high. DOT/USD is likely to be compelled to a range-bound move between the moving average lines. The altcoin will trend when the moving average lines are breached.
You can purchase crypto coins here. Buy LBLOCK
Note: Cryptosignals.org is not a 1a financial advisor. Do your research before investing your funds in any financial asset or presented product or event. We are not responsible for your investing results