Polkadot Plummets and Stays above the Low of $6.29
Estimated Reading Time: 2 minutes
Don’t invest unless you’re prepared to lose all the money you invest. This is a high-risk investment and you are unlikely to be protected if something goes wrong. Take 2 minutes to learn more

Polkadot (DOT) Long-Term Analysis: Bearish
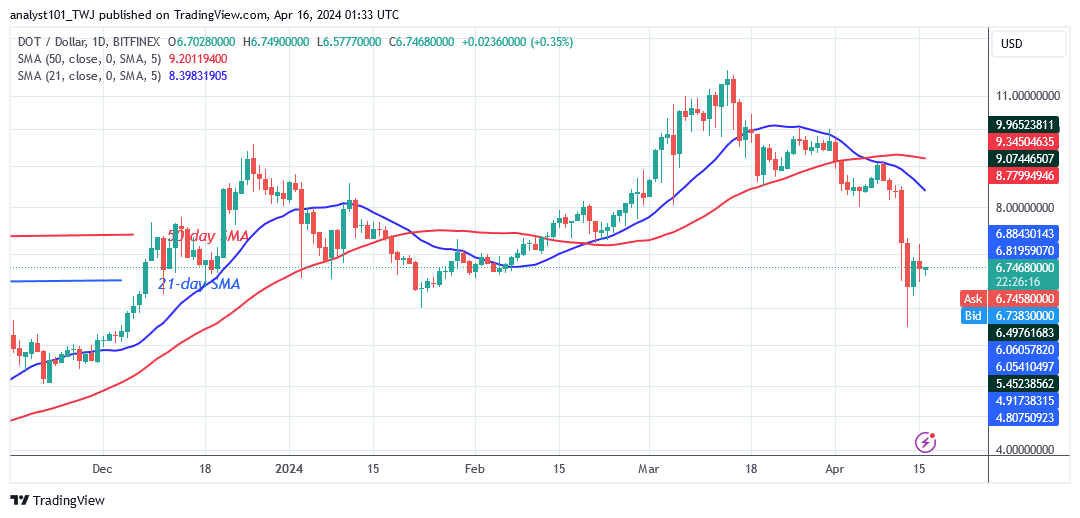
Polkadot’s (DOT) price has dipped below the moving average lines but stays above the low of $6.29. The cryptocurrency asset has plummeted to its previous low on January 23, 2024. Bulls purchased the dips, and the altcoin rose above $6.20. The selling pressure has subsided as DOT price trades above the $6.20 support and below the moving average lines, or the resistance at $9.25.
On the downside, the present support level has not been breached since December 11, 2023. However, if the current support is breached, DOT/USD will fall further to $4.84 low. However, if the $6.20 support level holds, the upswing will resume.
Technical indicators:
Major Resistance Levels – $10, $12, $14
Major Support Levels – $8, $6, $4
Polkadot (DOT) Indicator Analysis
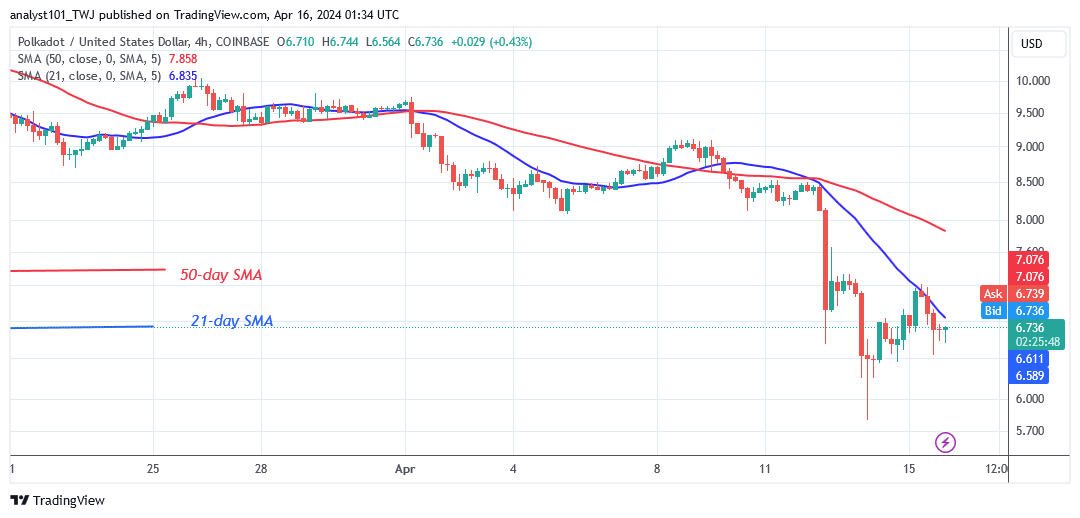
The price bars are below the downward sloping moving average lines. Polkadot shows a bearish crossover in both charts. The 21-day SMA has crossed below the 50-day SMA, indicating a bearish signal. The currency is currently trading above the $6.20 support, indicating that selling pressure has receded. On April 13, 2024, extended candlestick tails point to the existing support, signaling strong buying demand at lower price levels.
What Is the Next Direction for Polkadot (DOT)?
Since April 13, Polkadot has been fluctuating in a limited range but stays above the low of $6.29. The selling pressure has ended above the January 23, 2024 price level. The drop has come to a halt as the altcoin reached the market’s oversold level. Meanwhile, the crypto signal will trade in a range till the trend is determined.
You can purchase Lucky Block here. Buy LBLOCK
Note: Cryptosignals.org is not a financial advisor. Do your research before investing your funds in any financial asset or presented product or event. We are not responsible for your investing results


