Polkadot Reaches Bearish Exhaustion as It Holds Above $5.98
Estimated Reading Time: 2 minutes
Don’t invest unless you’re prepared to lose all the money you invest. This is a high-risk investment and you are unlikely to be protected if something goes wrong. Take 2 minutes to learn more

Free Crypto Signals Channel
Polkadot (DOT) Long-Term Analysis: Bearish
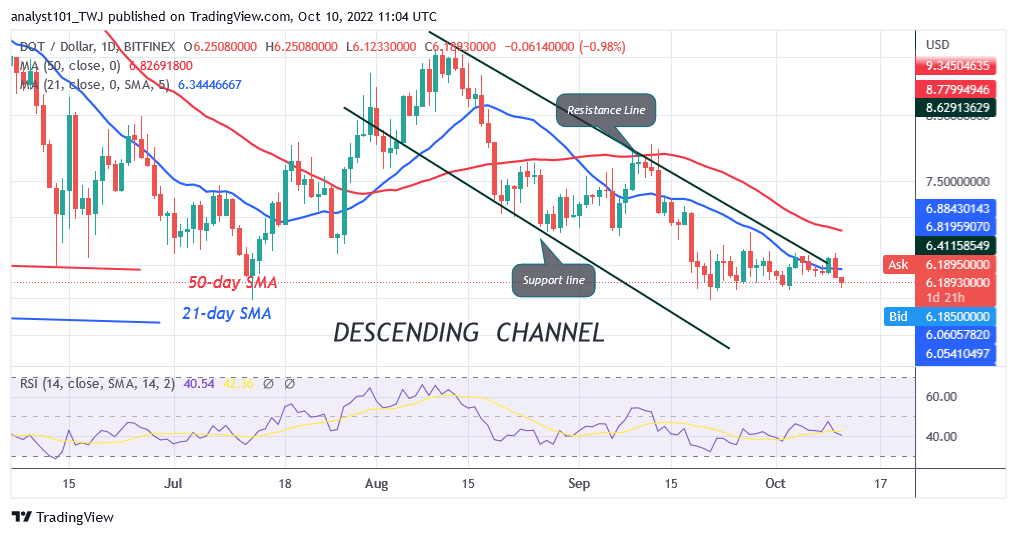
Polkadot’s (DOT) price is in a sideways move as it holds above $5.98. For the past three weeks, DOT/USD has been trading between $5.98 and $6.00 price levels. On October 9, buyers broke the 21-day line SMA but were repelled at the $6.00 resistance zone. This will be the fourth time the upward moves have been repelled. Presently, the current support at $5.98 has been holding since July 13. However, if the $6.00 support is breached the market would decline to the $4.00 low.
Polkadot (DOT) Indicator Analysis
Polkadot is relatively stable at level 40 of the Relative Strength Index for period 14. The selling pressure has been stalled as the price bars fluctuate below and above the 21- day line SMA. The cryptocurrency asset has been trading in the oversold region below the 20% range of the daily stochastic. The moving average lines slope downward but the 21-day line SMA is the resistance line to the price bars.
Technical indicators:
Major Resistance Levels – $10, $12, $14
Major Support Levels – $8, $6, $4
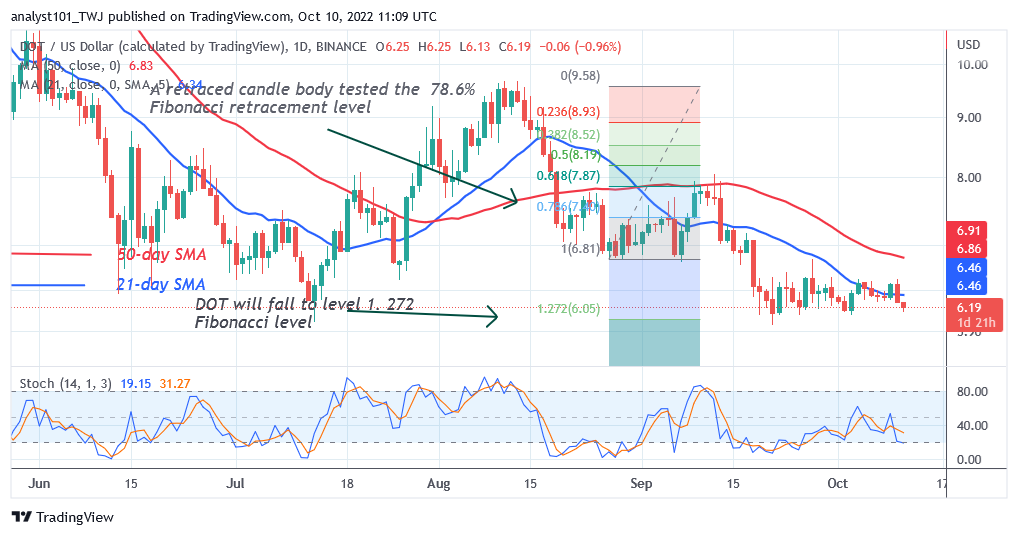
What Is the Next Direction for Polkadot (DOT)?
Polkadot has reached bearish exhaustion as it holds above $5.98. For the past three months, the support at $5.98 has been holding. On the August 27 downtrend; the DOT price corrected upward and a candle body tested the 78.6% Fibonacci retracement level. The corrections suggest that DOT will fall to level 1.272 Fibonacci extension or $6.05.
You can purchase crypto coins here. Buy LBLOCK
Note: Cryptosignals.org is not a 1a financial advisor. Do your research before investing your funds in any financial asset or presented product or event. We are not responsible for your investing results