Lucky Block (LBLOCK) Eyes Rebound: Key Levels to Watch
Estimated Reading Time: 2 minutes
Don’t invest unless you’re prepared to lose all the money you invest. This is a high-risk investment and you are unlikely to be protected if something goes wrong. Take 2 minutes to learn more

Lucky Block (LBLOCK) is showing signs of resilience, trading at $0.00001674. Despite recent price fluctuations, the charts suggest that the token could be poised for a potential comeback.
LBLOCK Daily Chart: Recovery in Sight?
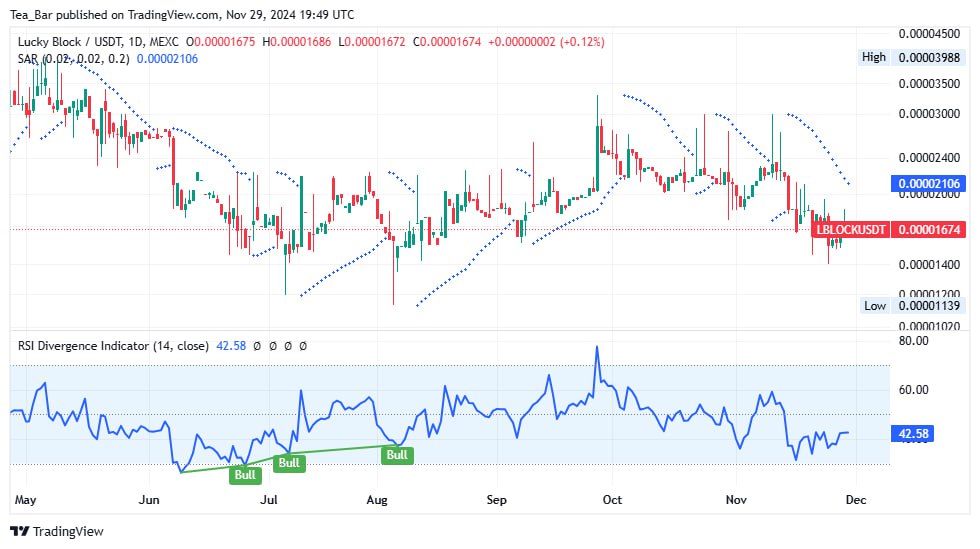
The daily chart reflects consolidation around the $0.00001674 mark. While the Parabolic SAR remains above the price, indicating a bearish trend, the RSI is at 42.58, signaling a potential move toward neutral ground. This suggests that selling pressure may be easing.
Key support is found at $0.00001139, with immediate resistance at $0.00002106. A break above this resistance could set the stage for further gains, providing bullish momentum if market conditions align.
4-Hour Chart: Balancing the Odds
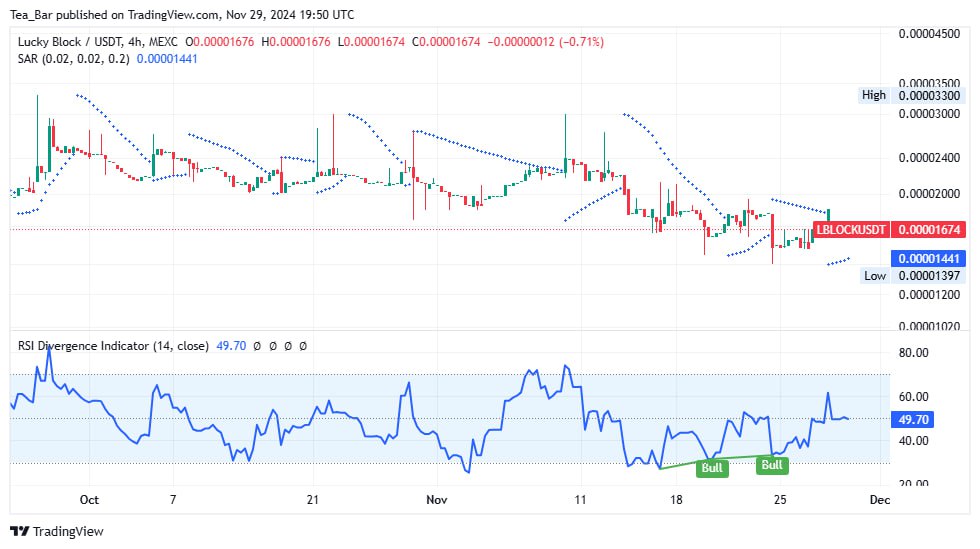
The 4-hour timeframe paints a more optimistic picture. The Parabolic SAR dots above the candles suggest the downtrend continues, but the RSI stands at 49.70, hovering near the neutral 50 level. This balance between buyers and sellers indicates potential for an upward breakout.
Support at $0.00001441 and resistance at $0.00002010 are critical levels to watch. A strong push above resistance could signal renewed buying interest and a trend reversal.
Outlook: Optimism Amidst Consolidation
Lucky Block’s current consolidation phase hints at an upcoming directional shift. Should buyers gain control and push LBLOCK past key resistance levels, a bullish breakout could follow. Traders should monitor RSI movements and SAR reversals for confirmation of upward momentum.
You can purchase Lucky Block here. Buy LBLOCK.