Lucky Block Holds Firm as Market Eyes the Next Expansion Phase
Estimated Reading Time: 3 minutes
Don’t invest unless you’re prepared to lose all the money you invest. This is a high-risk investment and you are unlikely to be protected if something goes wrong. Take 2 minutes to learn more

Lucky Block (LBLOCK) continues to attract attention as price action shows resilience despite short-term fluctuations. Trading near 0.00001492, the token remains comfortably above its recent lows, signaling that buyers are still active and defending key zones. Rather than weakening sentiment, the current structure suggests consolidation within a broader recovery framework, keeping Lucky Block firmly on the radar for traders and long-term participants alike.
Daily Chart – Stability After the Storm
On the daily chart, Lucky Block is displaying encouraging balance after a prolonged corrective phase. Price has consistently respected the 0.00001170 support area, which has now evolved into a reliable base. The Bollinger Bands are beginning to narrow, a development that often precedes a directional move, while price remains close to the mid-band around 0.00001550, indicating equilibrium rather than breakdown risk.
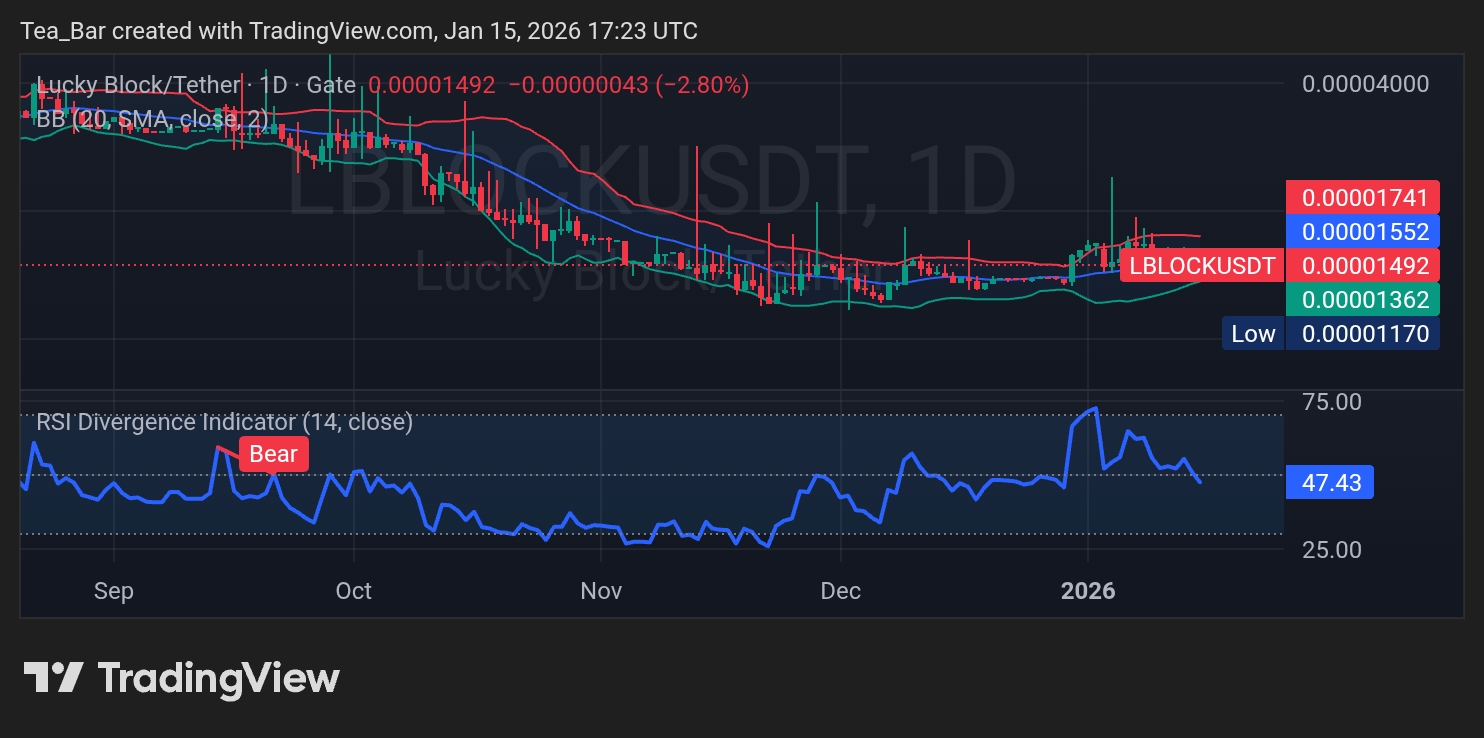
The RSI sits near neutral levels around the mid-40s, suggesting selling pressure is losing momentum. This stabilization phase is constructive, as it allows LBLOCK to build energy for a stronger continuation move. A daily close back above the 0.00001550–0.00001600 zone would reinforce confidence and open the door toward the upper resistance near 0.00001740.
4H Chart – Quiet Accumulation in Progress
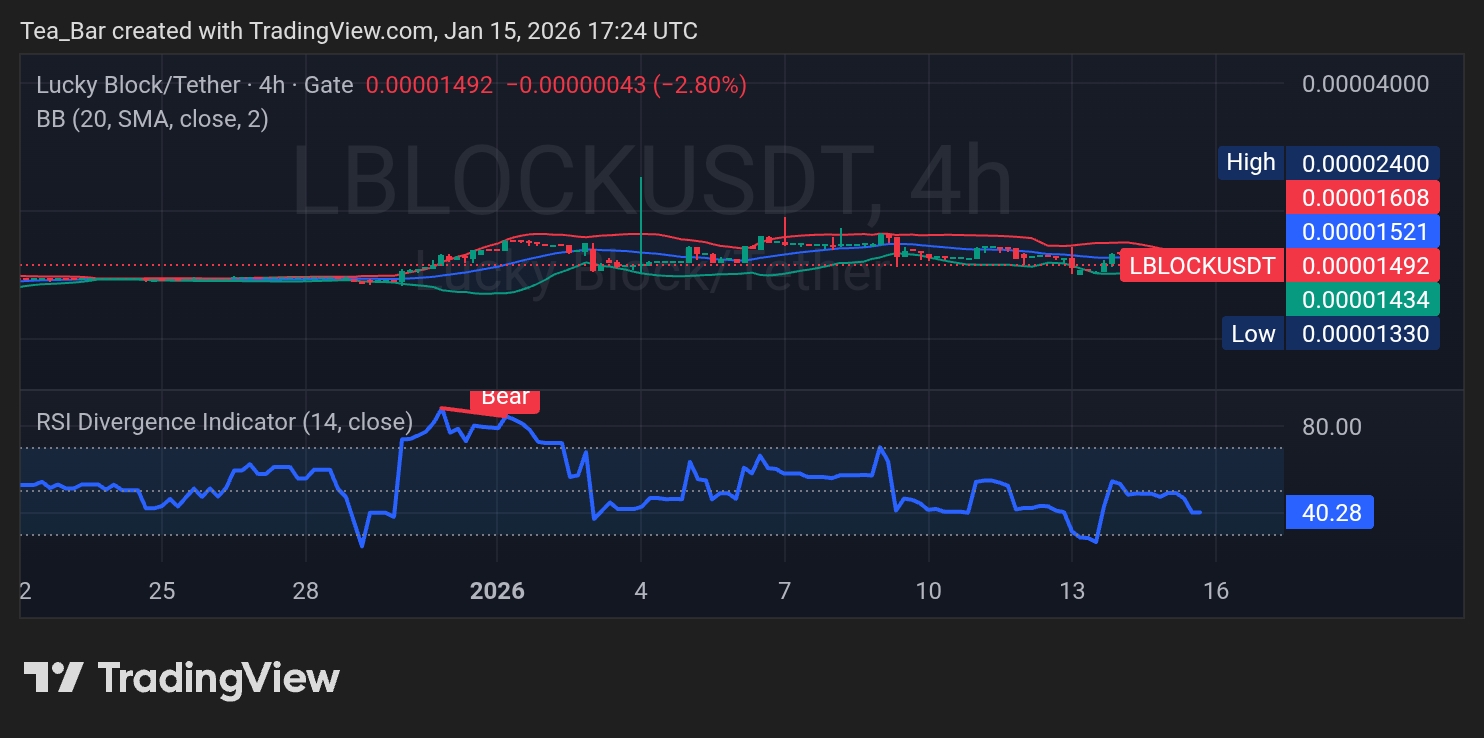
The 4-hour timeframe highlights subtle but important developments. Lucky Block is forming a tight range between 0.00001430 and 0.00001520, showing that volatility is being absorbed rather than accelerating downward. Such behavior typically reflects accumulation, especially after an extended downtrend.
RSI on the 4H chart remains below overbought territory, giving room for upside expansion once momentum returns. Price continuing to hold above the lower Bollinger Band supports the view that downside risks are limited, while repeated tests of the mid-band hint at growing buyer confidence.
Conclusion – Positioning for the Next Opportunity
Lucky Block remains well-positioned as it consolidates above key support levels. With selling pressure fading, volatility compressing, and accumulation signals emerging across timeframes, LBLOCK appears to be preparing for its next move. For those seeking exposure to a project building strength quietly, Lucky Block continues to present a compelling and forward-looking opportunity.
Invest wisely, and let Lucky Block’s potential work in your favor. You can purchase Lucky Block here. Buy LBLOCK