Binance Coin in a Downward Correction, Fluctuates Between $505 and $550
Estimated Reading Time: 2 minutes
Don’t invest unless you’re prepared to lose all the money you invest. This is a high-risk investment and you are unlikely to be protected if something goes wrong. Take 2 minutes to learn more

Binance Coin (BNB) Long-Term Analysis: Bullish
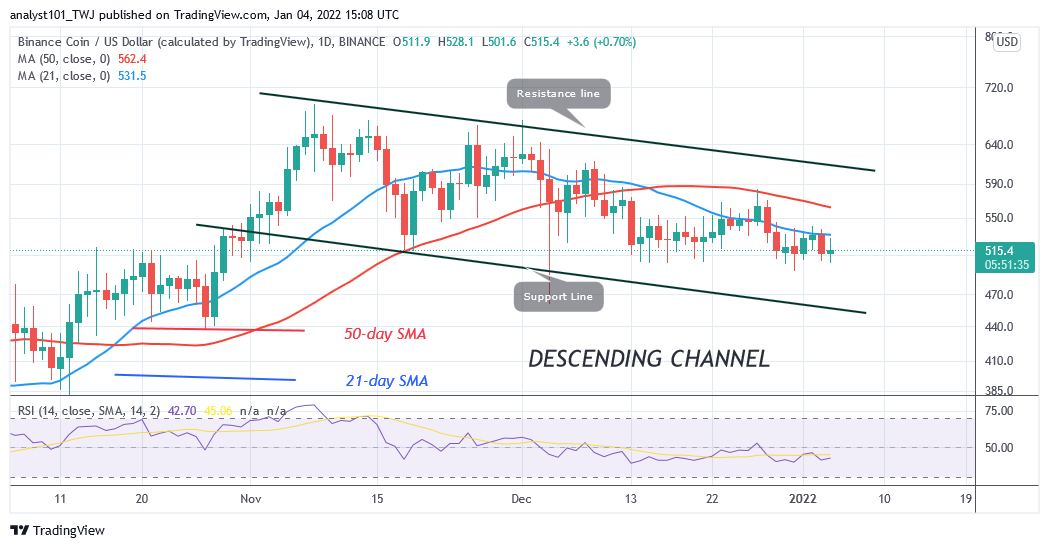
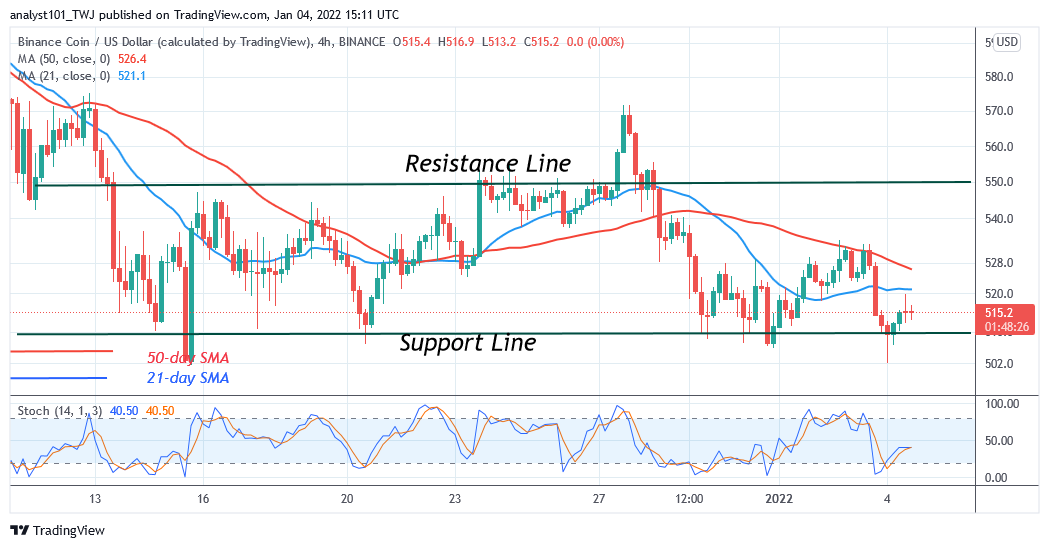
Binance Coin (BNB) is in a downward correction as price fluctuates between $505 and $550. Since December 13 price slump, the downtrend has subsided as the market resumed a sideways trend. On December 27, BNB price corrected upward but was resisted at the $580 high. The cryptocurrency was repelled as it fell to the bottom of the chart. The altcoin is now fluctuating above the $500 support but below the $550 resistance. The current support is characterized by candlesticks with long tails. This indicates that $500 support is a strong buying pressure.
Binance Coin (BNB) Indicator Analysis
BNB price is below the moving averages indicating a further downward movement of prices. BNB is at level 42 of the Relative Strength Index period 14. It indicates that the altcoin has fallen to the downtrend zone and below the centerline 50. BNB is above the 40% range of the daily stochastic. It indicates that it is in a bullish momentum.
Technical indicators:
Major Resistance Levels – $640, $660, $680
Major Support Levels – $540, $520, $500
What Is the Next Direction for Binance Coin (BNB)?
BNB/USD is in a range-bound move as price fluctuates between $505 and $550. Since December, the altcoin has been fluctuating between $505 and $550 price levels. The bears have retested the lower price range on four occasions without breaking below it. The upward move is likely to resume upward. The current support has been holding since September.
You can purchase crypto coins here. Buy Token
Note: Cryptosignals.org is not a financial advisor. Do your research before investing your funds in any financial asset or presented product or event. We are not responsible for your investing result