Bitcoin Cash (BCH/USD) Market Faces Downward Pressure amid Renewed Bearish Momentum Shift
Estimated Reading Time: 4 minutes
Don’t invest unless you’re prepared to lose all the money you invest. This is a high-risk investment and you are unlikely to be protected if something goes wrong. Take 2 minutes to learn more
BCH Price Prediction—October 29
BCHUSD market faces downward pressure amid a renewed bearish momentum shift. The BCHUSD pair remains under sustained bearish pressure as market sentiment weakens below the 9-day Simple Moving Average positioned around $520.
The overall trend structure continues to favor sellers, with momentum indicators aligning with this direction. The Stochastic oscillator is currently overbought near the 90 level, suggesting a potential exhaustion of short-term bullish corrections and an increased likelihood of renewed downside momentum. This alignment between price action and indicator readings reinforces the prevailing bearish market outlook.
BCH/USD Market Key Levels:
Resistance levels: $524.30, $632.60, $680.00
Support levels: $462.00, $377.90, $249.20

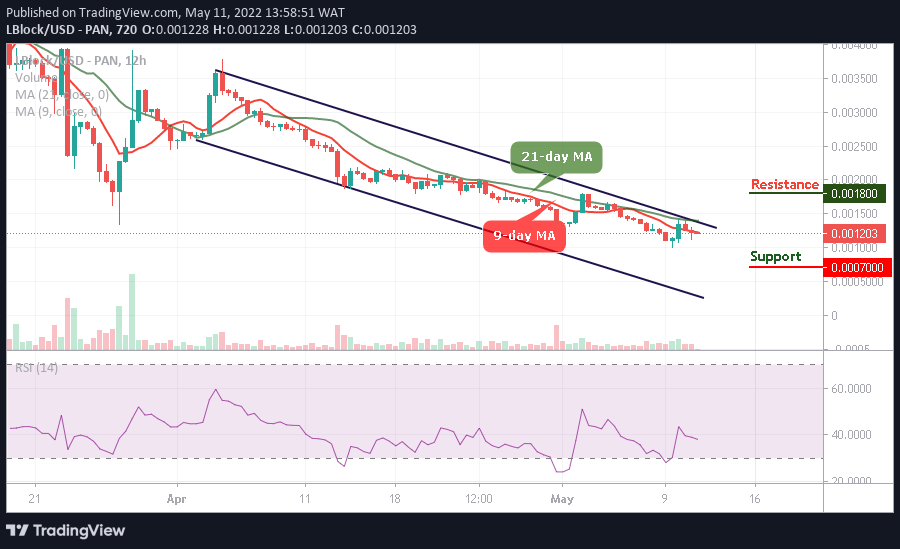
BCH/USD – Daily Chart
The BCH/USD daily chart shows a bearish trend alongside a falling trendline.
Technically, BCHUSD has tested the descending trendline resistance around $565 but failed to secure a breakout, signaling persistent selling interest at higher levels. The price also formed a short-term lower high structure, confirming the dominance of sellers and the continuation of a downward sequence. Previous bullish attempts were rejected around $550–$570, leaving $533 and $524 as critical intermediate support zones. The sustained trading below the bearish trendline and inability to hold gains above the $550 handle confirm limited buyer strength in the current structure.
In this video, Cesar discusses the current state and future prospects of Bitcoin Cash (BCH), emphasizing the importance of perspective when interpreting short-term price drops. Despite recent declines—Bitcoin Cash is down about 10% since the 10th compared to the average altcoin’s 3%—Cesar argues that this is a temporary shakeout after a strong upward run and not a sign of long-term weakness. He highlights that since April, Bitcoin Cash has outperformed the average altcoin, gaining roughly 87% compared to 37% for others. Using technical analysis, Cesar points out bullish patterns like the “break, hook, and go” formation and V-shaped recovery examples from Bitcoin’s past, suggesting a strong rebound is imminent.
He explains that current dips and lower volumes during sell-offs are often conducive to rapid recoveries, and that the recent price action around important support levels—such as $443 to $468—shows resilience. Although he acknowledges bearish momentum indicators on shorter timeframes (RSI, MACD, Stochastics) and the possibility of a slight further dip to around $420-$450, Cesar remains optimistic overall. He foresees a significant rally starting possibly after the weekend, continuing through the end of the month and beyond.
What is the projection for the BCHUSD market?
Looking ahead, BCHUSD is likely to resume its decline toward the next support levels at $520 and potentially $462 if bearish momentum strengthens. A decisive break below $524 would accelerate selling pressure and open the path for a deeper correction. Conversely, only a strong daily close above $575 would invalidate the current bearish setup and suggest a short-term trend reversal. Until such confirmation emerges, the market bias remains firmly tilted toward further downside retracement.
Bitcoin Cash (BCH) Current Statistics
The current price: $562.70
Market Capitalisation: $11,070,000,000
Trading Volume: $528,120,000
Place winning BCH trades with us. Get BCH here