BNB Market Trades at a Multi-Month High
Estimated Reading Time: 2 minutes
Don’t invest unless you’re prepared to lose all the money you invest. This is a high-risk investment and you are unlikely to be protected if something goes wrong. Take 2 minutes to learn more

- BNB maintains strong bullish momentum, trading near a multi-month high and above the $700 level.
- The SRSI shows an upward crossover near 20, indicating that bullish momentum may have room to strengthen.
- If the bullish trend continues, BNB could target the $1,000 level.
The Binance token’s price has strong bullish sentiment surrounding it. This has pushed it to a high last seen in May. There are indications that the market may still move significantly higher, and analysts are of the opinion that the market has just delivered a strong bullish signal.
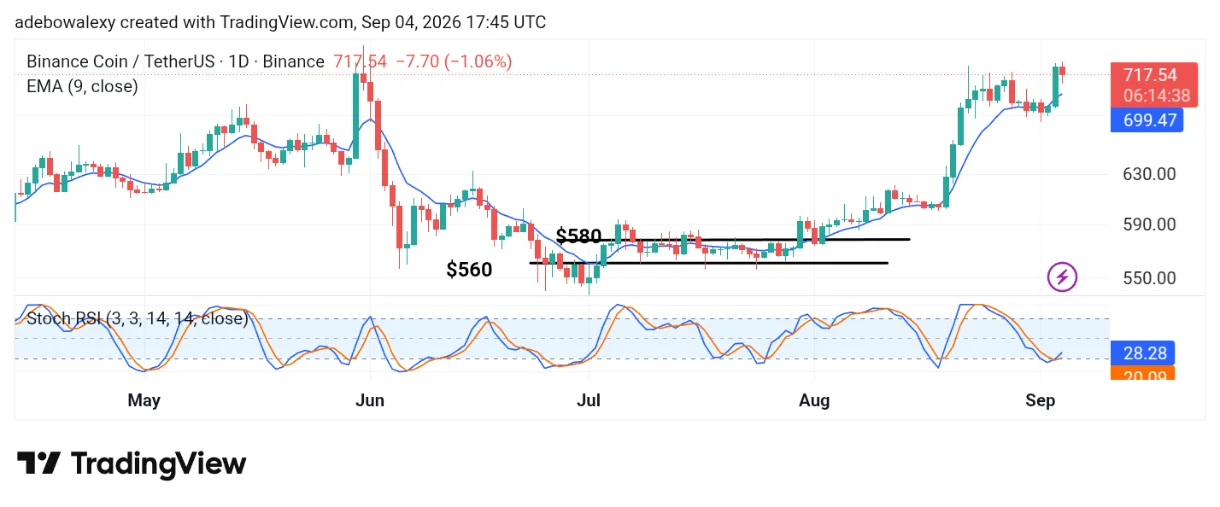
BNB on a 24-Hour Market Chart
While the BNB/USDT market has experienced a slight decline in the ongoing session, price action has remained at a significantly elevated level. This keeps the market above the 9-day Exponential Moving Average (EMA) and the $700 price level.
Meanwhile, the Stochastic Relative Strength Index (SRSI) indicator lines have just delivered an upward crossover around the 20 level.
BNB Bulls Have a Strong Base
With price action standing at an elevated level above the 9-day EMA, while the ongoing session has shown only a slight downward movement, buyers appear to have a strong influence on the market.
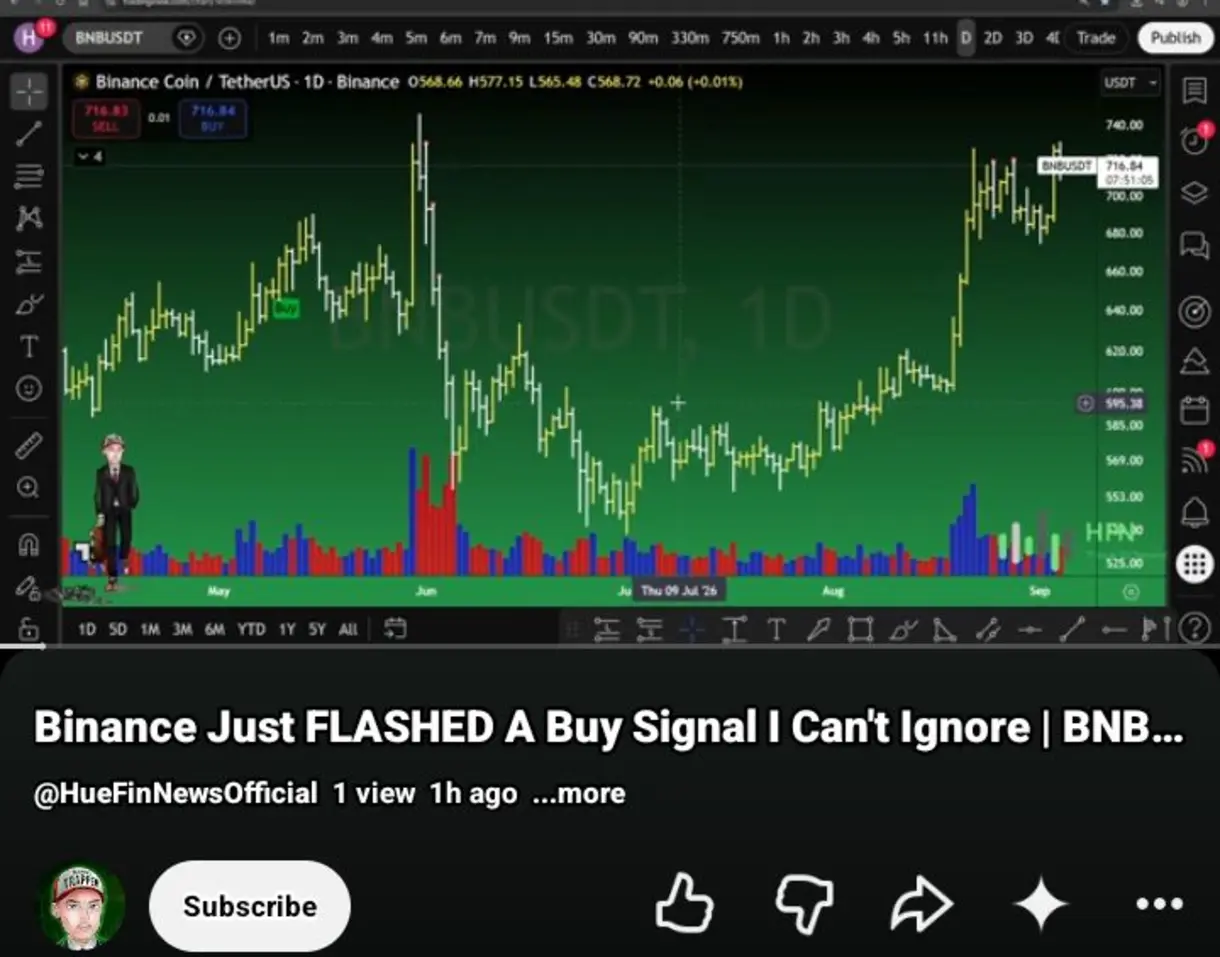
The SRSI indicator lines are also still below the 30 level, suggesting that upside momentum has plenty of room to develop. Therefore, more traders may continue buying, potentially causing the market to keep heading northward.
BNB May Hit the $1,000 Ceiling
Ever since the BNB/USDT market broke out of the $560-$580 range, the token has remained very bullish. The recent upward crossover of the SRSI indicator lines around the 20 level suggests that upside momentum is still building. Therefore, traders can target price levels around $1,000.