Cardano (ADA/USDT) Teetering on the Edge of a Breakdown
Estimated Reading Time: 3 minutes
Don’t invest unless you’re prepared to lose all the money you invest. This is a high-risk investment and you are unlikely to be protected if something goes wrong. Take 2 minutes to learn more
Cardano Mid-term Analysis: Bearish
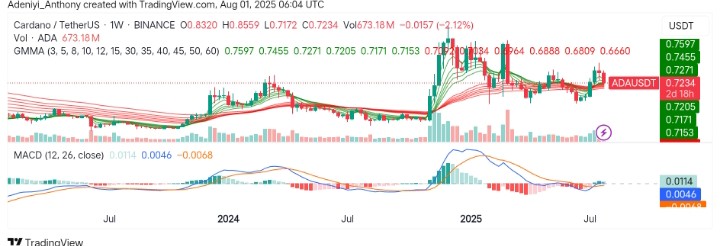
Cardano against Tether has found itself in a precarious position. The market seems to be decisively bearish, fueled by a sharp intraday rejection from the $0.8559 high and a close near the session low at $0.7234—a 2.12% drop. However, high selling volume (673M ADA) confirms aggressive distribution, signaling institutional or whale-driven capitulation.
To this end, recent price action reveals a failed recovery attempt, with ADA slicing through multiple moving averages. As it stands, the pair now hovers just above critical support at $0.7172, teetering on the edge of a breakdown. If bulls fail to defend this level, we could see an accelerated downtrend toward mid-2024 lows.
Currently, Cardano trades at $0.7234 with over 670 million traded volumes for the week.
Technical Indicators
Major Resistance Levels: $0.7271, $0.7455, and $0.7597
Major Support Levels: $0.6888, $0.6660, and $0.6000
Cardano Technical Analysis
Technically, Cardano against Tether screams caution on the weekly timeframe. However, the Guppy Multiple Moving Averages (GMMA) seems to be compressing and suggesting the bears own this tape with a good amount of traded volumes.
Also, the MACD appears to have crossed below its signal line, while the histogram prints, suggesting an accelerating bear momentum. This presents a break-or-make situation, as a break beyond the current level would send the pair down to $0.6660; otherwise, bullish action would push the price above $0.7455.
ADA/USDT Daily Analysis: Where from Here?
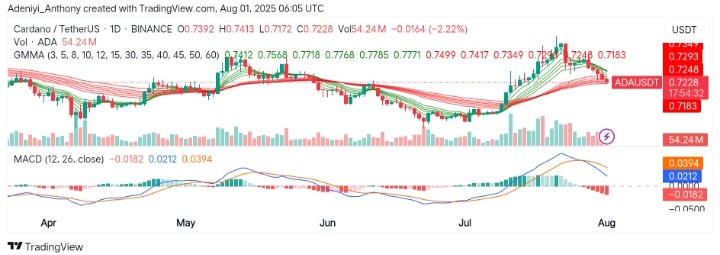
On the daily chart, ADA/USDT appears to be closing at $0.7228 compared to the previous close at $0.7234, reinforcing the further downtrend and pressing against the critical $0.7172 support. However, technically, the tight GMMA grouping confirms the consolidation phase, amplifying the significance of a break.
However, while the weekly chart showed bearish MACD, the MACD displays a positive histogram (+0.0394) despite lower prices, suggesting a hidden bullish divergence warning for shorts.
To this end, it is clear that the bears need a close below $0.7172 on rising volume to continue the breakdown, while bulls require a decisive reclaim of $0.7271/$0.7293 to stage a reversal.
You can purchase crypto coins here. Buy LBlock