Chainlink (LINK/USDT) Seeks to Break Above $14.95 Amid Overbought Condition
Estimated Reading Time: 3 minutes
Don’t invest unless you’re prepared to lose all the money you invest. This is a high-risk investment and you are unlikely to be protected if something goes wrong. Take 2 minutes to learn more

Chainlink Long-term Analysis: Bullish
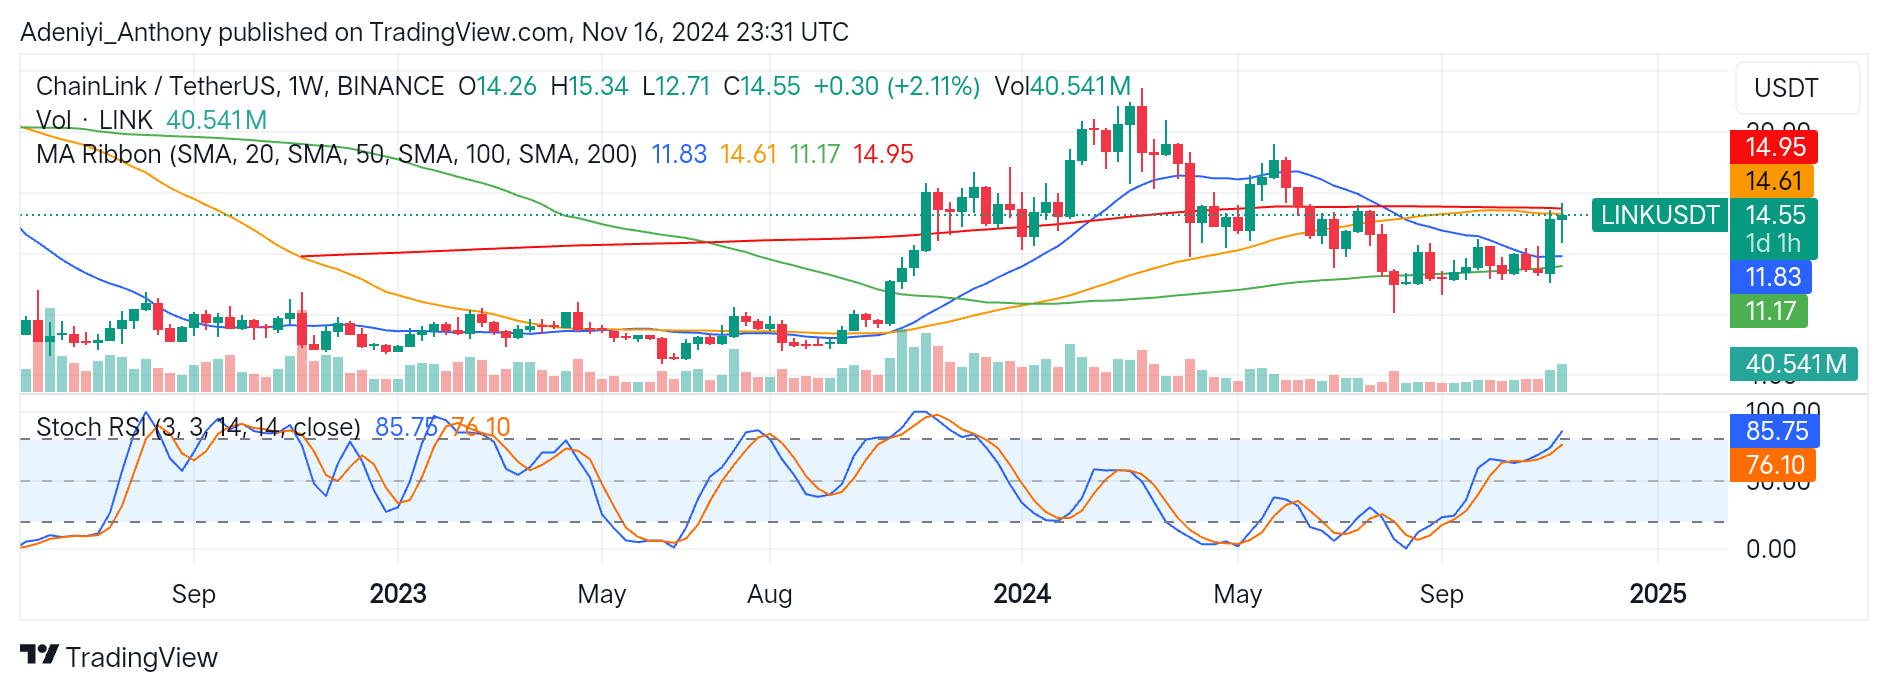
Recently, Chainlink (LINK) against the Tether (USDT) has increased activity, with the pair testing a major resistance level. The ongoing trajectory demonstrates strong bullish momentum, with LINK/USDT pushing toward the 200-week simple moving average at $14.95. However, the overbought condition signal by the Stochastic RSI suggests the pair may be due for a pullback in the near term.
LINK, in recent weeks, has been operating above the shorter moving averages; this action suggests a mid-term bullish sentiment. However, the recent candlestick formation indicates the pair is reaching to break above the 200-week line to confirm recovery from a long-term bearish trend.
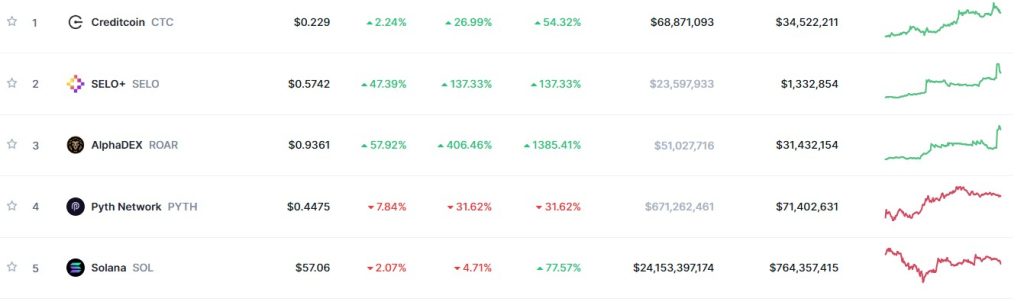
Currently, Chainlink is trading at $14.55, with a 2.11% positive trade above the previous session. This marks a continued recovery from the recent low, while concerns about whether the pair can sustain the upward push or face rejection at the 200-week (SMA) resistance level heightened.
Technical Indicator
Major Resistance Levels: $14.61, $14.95, and $16.00
Major Support Levels: $11.83, $11.17, and $10.00
ChainLink Technical Analysis
Chainlink against the Tether has experienced bullish momentum after a prolonged consolidation period. The pair appears to be testing a major dynamic and historical level, and LINK must close decisively above this level ($14.95) to confirm a long-term trend reversal. A sustained bullish momentum above the $14.95 could pave the way towards the $16 and $ 18 levels.
However, the stochastic RSI suggests the pair is already overbought with room for more development to the upside. With the lines reading 85.75 and 76.10, LINK/USDT bullish momentum may encounter resistance leading to a potential price pullback. Conversely, if the overbought condition does not lead to an immediate sell-off, LINK/USDT, with the support of the strong volume, may advance towards the $16 level. Moreover, if the price fails to hold above the 200-week (SMA), a pullback to the 20-week (SMA) at $11.83 could occur.
LINK/USDT Analysis: A Sustained Uptrend or a Pullback?
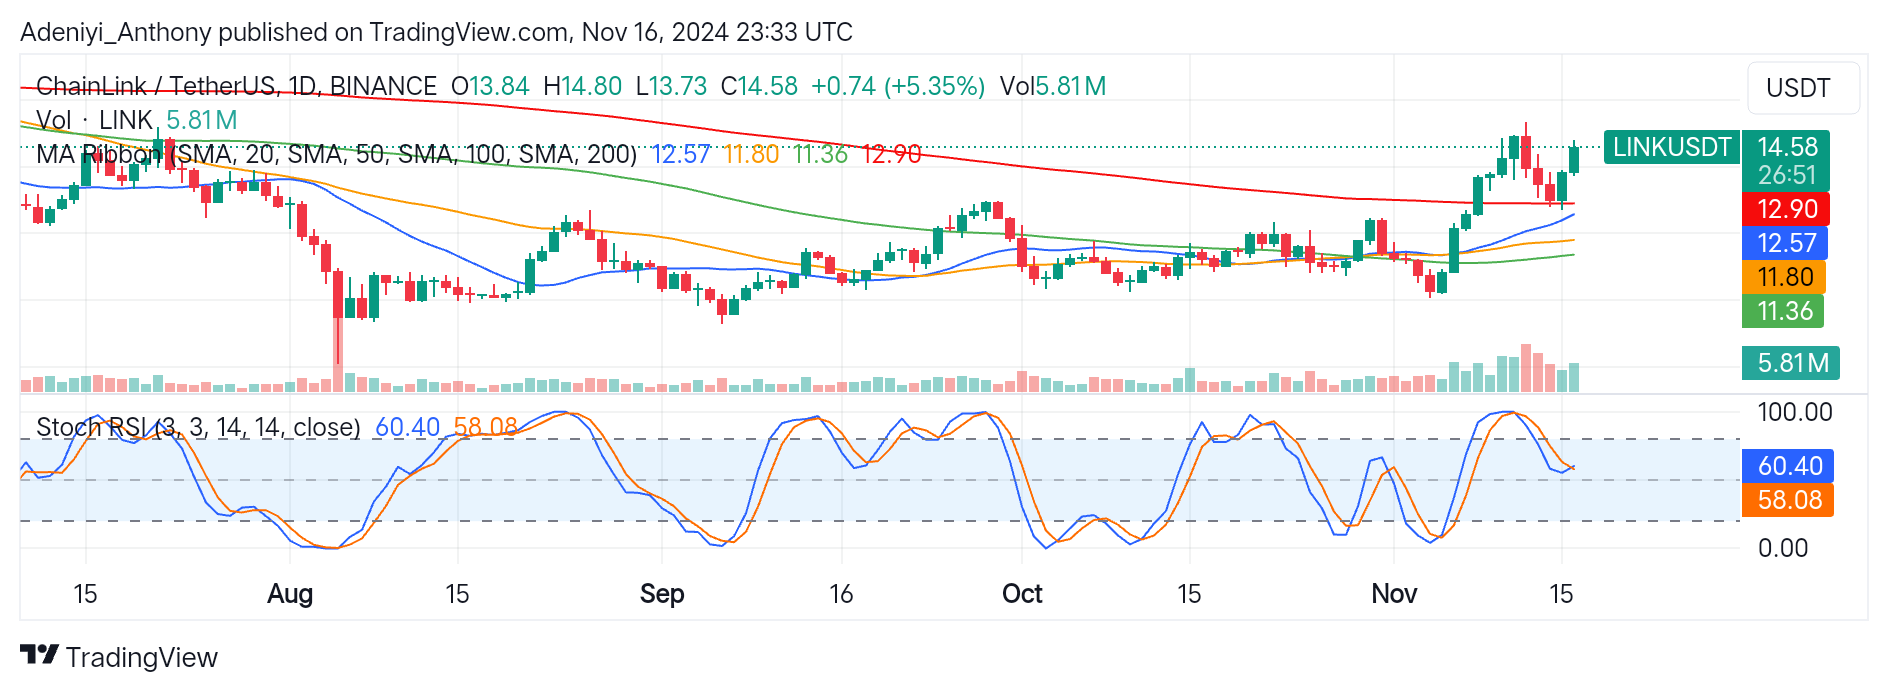
On the daily timeframe, LINK/USDT bullish traders regain control after a recent pullback reflecting a 5.35% increase above the previous session, with the pair aiming at $14.80. The chart shows a bullish sentiment, with the pair maintaining strong upside momentum above the 200-day SMA at $12.90.
The Stochastic RSI signals that the pair operates in the neutral zone. This indicate that more improvement beyond $14.58 to the North can still hold. However, for a confirmed long-term upside movement, the converged lines of the oscillator must complete the current crossover, and the 20-day line must be above the 200-day moving average.
You can purchase crypto coins here. Buy LBlock