Chainlink (LINK/USDT) Seeks to Extend Bullish Frontier
Estimated Reading Time: 3 minutes
Don’t invest unless you’re prepared to lose all the money you invest. This is a high-risk investment and you are unlikely to be protected if something goes wrong. Take 2 minutes to learn more

LINK Long-term Analysis: Bullish
The market for Chainlink against Tether has experienced a strong surge to the north in recent times, with attempts to move further to the upside. However, the pair appears to be testing the immediate resistance level, as indicated by the MACD, to maintain a continued uptrend.
At the moment, the market is moderately bullish, with the price of the pair breaking above the upper line of the Bollinger Bands, indicating a strong bullish pressure on the market. However, the positioning of the pair’s price above $20.30 warrants caution as the pair trades deep into the overbought zone.
Currently, Chainlink trades at $22.06 with over 32.4 million traded volumes for the week.
Technical Indicators
Major Resistance Levels: $22.50, $23.80, and $28.00
Major Support Levels: $21.57, $20.32, and $18.33
Chainlink Technical Analysis
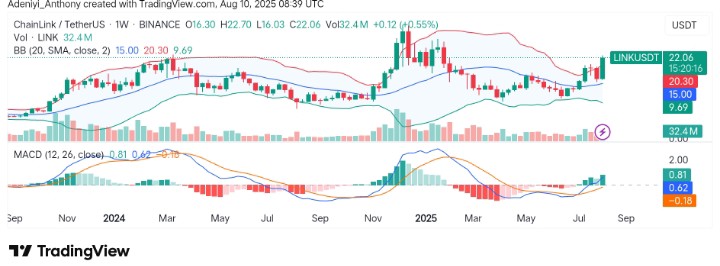
On the weekly timeframe, the analysis of Chainlink against Tether shows the price is volatile but generally bullish, characterized by a break above previous resistance and the possibility of surging upward depending on the reaction to the $22.49 level. However, the Bollinger Bands appear to be expanding, indicating the market holds a promising move beyond $22.50, as the traded volume supports a continued bullish trend.
Beneath the chart, the MACD is displaying a bullish histogram. This suggests momentum is still bullish and growing. However, more bullish participation is required for further movement to the north. To this end, a break above $22.50 in the current session would guarantee a move beyond $23.00 in the coming session.
LINK/USDT Analysis: Gearing Up for Further Gains
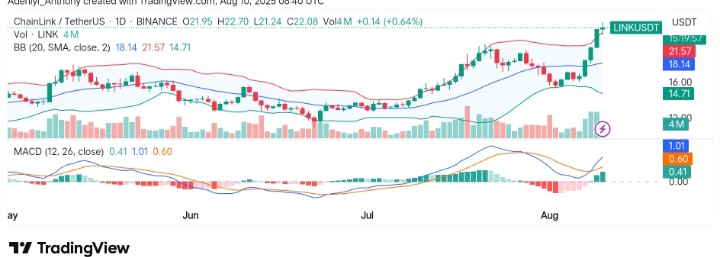
On the daily timeframe, LINK/USDT appears to be moving towards a new resistance level after breaking above $21.57 with over 4.01 million daily traded volumes. However, the operation of the price around the upper segment of the bands suggests caution due to the possibility of a pullback from an overbought region.
From another angle, the MACD indicator signals the pair is going for more gains as the histogram displays positive signs, confirming buying interest.
To this end, if the price can break above $22.49 in the session, further gains would be possible; otherwise, a correction back to $21.50 would surface before further bullish attempts.
You can purchase crypto coins here. Buy LBlock