Polkadot Advances but Encounters an Initial Barrier at $6.55
Estimated Reading Time: 3 minutes
Don’t invest unless you’re prepared to lose all the money you invest. This is a high-risk investment and you are unlikely to be protected if something goes wrong. Take 2 minutes to learn more

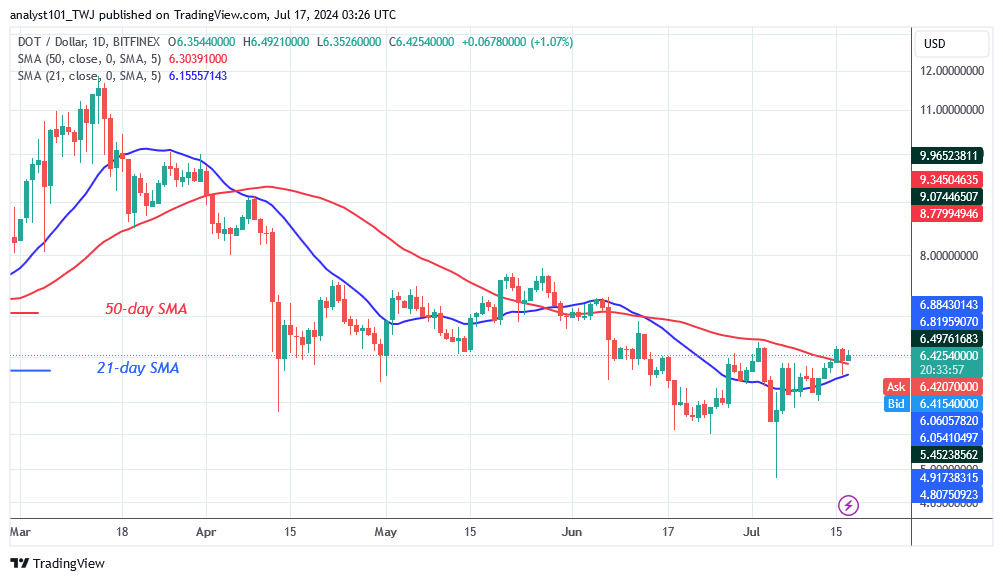
Polkadot (DOT) Long-Term Analysis: Bearish
Polkadot’s (DOT) price has recovered but encounters an initial barrier at $6.55. On July 5, the cryptocurrency plunged as low as $4.90. The bulls purchased the dips, and the altcoin rose between the moving average lines but remained strapped for a week. Polkadot is heading ahead, having broken above the 50-day SMA to reach a high of $6.55. On the upside, if the positive momentum continues, the market will rise to the $7.20 high.
However, the rising trend is meeting an initial resistance near the high of $6.55. The bullish momentum has reached a new high but has now pulled back above the moving average lines. The upward trend will resume if the existing support holds and the initial barrier is broken. However, if the DOT price loses its support, it will fall further. Currently, the altcoin is valued at $6.43.
Technical indicators:
Major Resistance Levels – $10, $12, $14
Major Support Levels – $8, $6, $4
Polkadot (DOT) Indicator Analysis
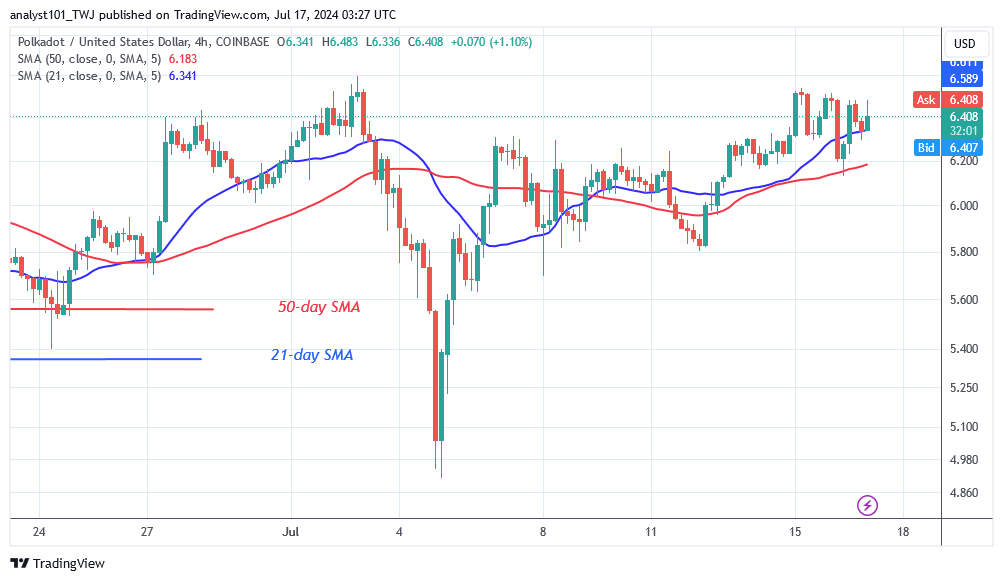
The price bars have returned above the moving average lines after being trapped between them for a week. Polkadot will rise as the price bars are above the moving average lines. However, the altcoin fluctuates above the moving average lines while facing an initial barrier. On the 4-hour chart, the moving average lines have a bullish crossover indicating the rise of the cryptocurrency..
What Is the Next Direction for Polkadot (DOT)?
Polkadot is rising on the 4-hour chart but encounters an initial barrier at $6.55. On July 2, the altcoin was repelled when it retested the $6.60 resistance level. This prompted the altcoin to drop to a low of $4.94. Nonetheless, if buyers conquer the recent high, Polkadot will advance to the next resistance level at $7.28. Meanwhile, the crypto signal is positive as the price bars are above the moving average lines.
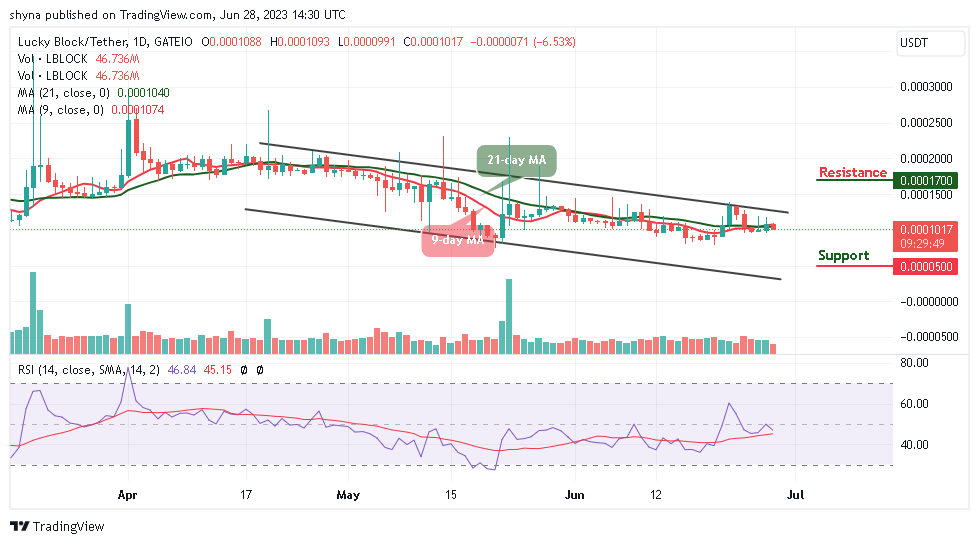
You can purchase Lucky Block here. Buy LBLOCK
Note: Cryptosignals.org is not a financial advisor. Do your research before investing your funds in any financial asset or presented product or event. We are not responsible for your investing results.