Dogecoin (DOGE/USD) Awakens from Slumber, Surging with Vigor
Estimated Reading Time: 3 minutes
Don’t invest unless you’re prepared to lose all the money you invest. This is a high-risk investment and you are unlikely to be protected if something goes wrong. Take 2 minutes to learn more
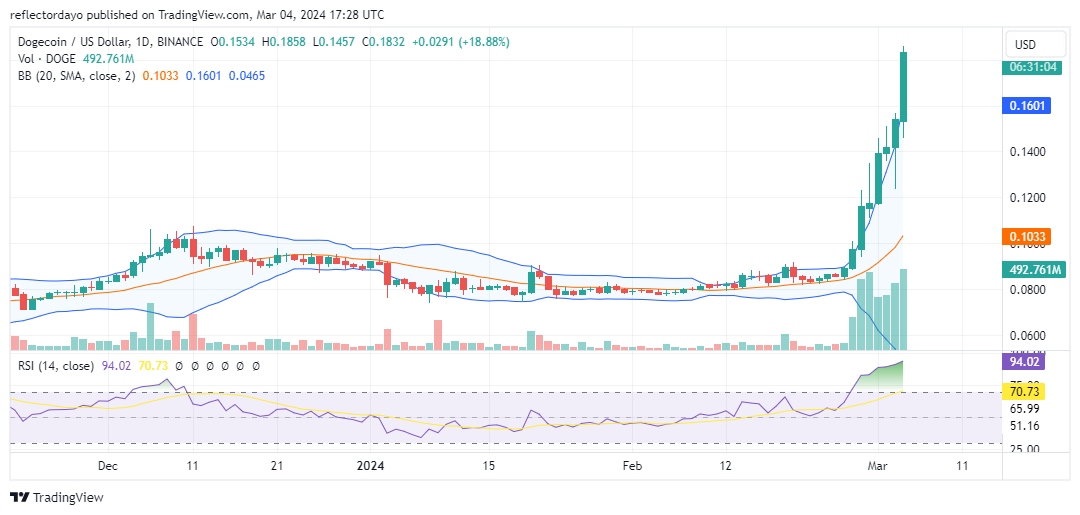
Since the commencement of the year, the Dogecoin market has maintained a steady position around the $0.080 price level. However, as February drew to a close, there was a notable departure from the narrow price channel at the $0.08 threshold. Subsequent days revealed a strengthening of the bullish momentum, indicating the potential sustainability of the upward trend. Nonetheless, the assertiveness of the bullish market may also prompt significant bearish resistance to emerge.
Dogecoin Market Data
- DOGE/USD Price Now: $0.182
- DOGE/USD Market Cap: $26 billion
- DOGE/USD Circulating Supply: 143 billion
- DOGE/USD Total Supply: 143 billion
- DOGE/USD CoinMarketCap Ranking: #9
Key Levels
- Resistance: $0.50, $0.53, and $0.55.
- Support: $0.40, $035, and $030.
Dogecoin Market Analysis: The Indicators’ Point of View
The price action has exceeded the 20-day moving average since the first half of February. By mid-February, bullish momentum had become evident within a narrow price channel. Even the 20-day moving average, influenced by the slight shift favoring the bulls, began to incline upward. Towards the end of February, the market experienced a decisive breakout in the upward direction, triggering heightened volatility levels and bolstering the bearish resistance at key levels. However, this did not deter the ongoing bull market. The trade volume indicator reflects a notable interest from traders to buy, suggesting the potential continuation of the bullish trend. Nonetheless, the diverging Bollinger Bands are pointing to an increase in volatility, and this crypto signal indicates the possibility of a significant correction in the event of a downturn. Therefore, traders may opt to await a potential consolidation phase at higher price levels before considering entry during the next surge.
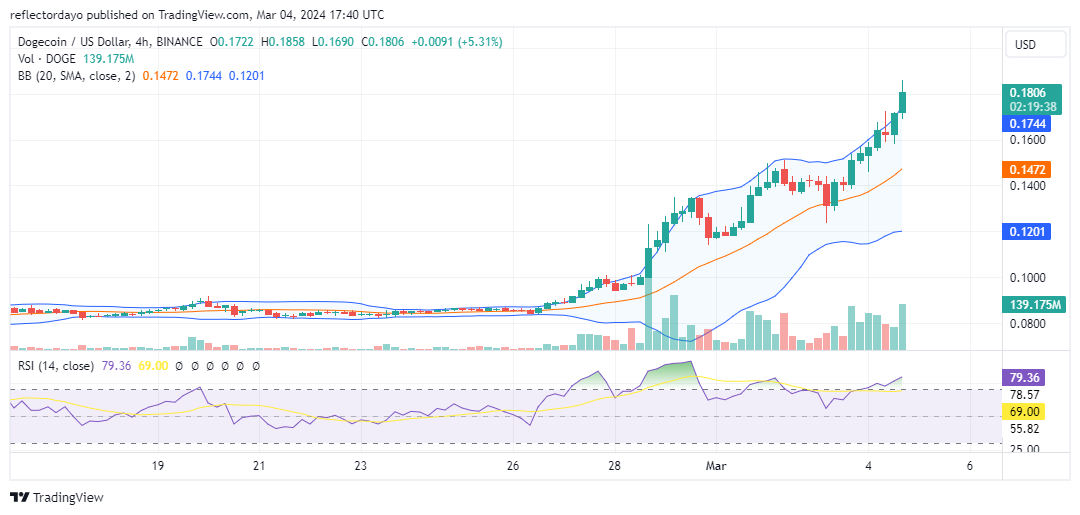
DOGE/USD 4-Hour Chart Outlook
Examining the market through the lens of the 4-hour chart, a robust bullish trend is evident, suggesting the potential for continued upward movement. The volume of trade indicator indicates significant trading activity and investor interest. Additionally, in the Bollinger Bands indicator, both the upper and lower bands, along with the moving average, are trending upward. Despite the RSI signaling the market’s entry into the overbought zone, it also suggests the possibility of further bullish actions, indicating potential room for continued upward momentum.