EigenLayer (EIGEN/USDT) Consolidates Amid Bearish Structure
Estimated Reading Time: 3 minutes
Don’t invest unless you’re prepared to lose all the money you invest. This is a high-risk investment and you are unlikely to be protected if something goes wrong. Take 2 minutes to learn more

The market for EigenLayer against Tether has experienced a mild recovery phase followed by a prolonged downtrend in recent weeks. However, the pair saw shift in structure late April this year as market volume surged and bullish candles broke above the Guppy Multiple Moving Averages (GMMAs), signaling a trend reversal.
Recently, the pair attempts to build momentum but found itself under short-term pressure. Despite this, the Stochastic RSI indicates the pair may be gearing up for an upside action in the coming session.
Currently, EigenLayer trades at $1.193 with minor daily gains of +0.76%, suggesting a temporary consolidation.
Daily Technical Indicators
Major Resistance Levels: $1.296, $1.317, and $1.355
Major Support Levels: $1.193, $1.125, and $1.000
Eigenlayer Technical Analysis
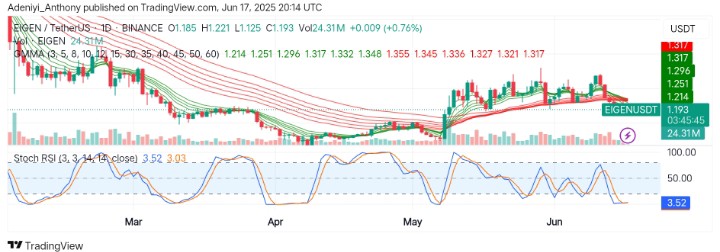
The daily chart of Eigenlayer against the Tether shows the pair is currently consolidating within a GMMAs cluster, revealing price behavior over short and long periods. However, between April and May, a strong bullish breakout occurred with the short-term GMMAs lines crossing above the long-term lines, confirming an uptrend.
As it stands, the current price action is retracing and testing the mid-GMMAs cluster support; therefore, a break in either direction may be seen in the coming session.
On the other hand, the volume has slightly decreased, suggesting a typical pullback setup. However, the stochastic RSI is currently flattened at the oversold zone, hinting at a potential reversal to the upside if the price can reclaim the $1.200 level.
EIGEN/USDT: Expectations
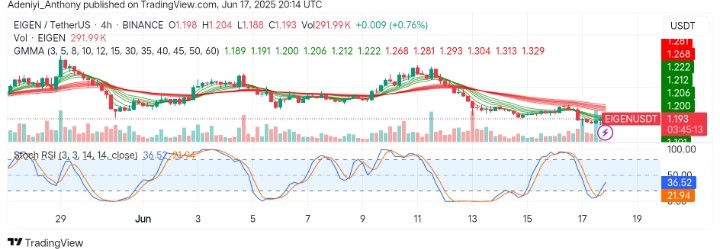
On the 4-hour chart, the price action of EIGEN/USDT reveals a prolonged bearish pressure as the price trades below the long-period EMAs with a relatively low volume, signaling a lack of conviction from the bulls and the bears.
On the other hand, a minor bounce from $1.188 support aligns with the Stochastic RSI emerging from the oversold zone (currently at 36.52). This setup suggests a short-term relief rally may occur, especially if buyers defend the $1.190–$1.193 zone.
To this end, the price must break above the $1.200 and $1.212 levels for confirmation of a bullish recovery; otherwise, the narrative may continue in favor of the bears.
You can purchase crypto coins here. Buy LBlock