Ethereum (ETH/USDT) Reclaims Momentum—Eyes on Breakout Continuation
Estimated Reading Time: 3 minutes
Don’t invest unless you’re prepared to lose all the money you invest. This is a high-risk investment and you are unlikely to be protected if something goes wrong. Take 2 minutes to learn more

ETH/USDT Long-term Analysis: Bullish
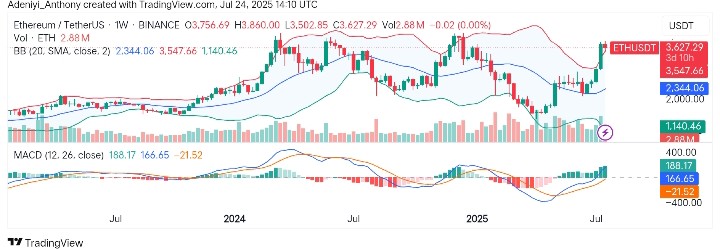
The Ethereum against Tether market pair this week is showing a strong shift in sentiment from bearish to bullish, however, after several weeks of downward movement earlier in the early part of the year. However, the price has staged a solid recovery, currently trading above $3,500, while attempting to stabilize above the upper Bollinger Bands.
To this end, a breakout has occurred, marked by rising volume, confirming increased market participation. However, if the momentum continues, ETH could make a fresh attempt to revisit higher resistance zones in the near term.
Currently, Ethereum trades at $3,627.29, printing over 2.8 million traded volumes for the week.
Technical Indicators
Major Resistance Levels: $3,860, $4,300, and $4,850
Major Support Levels: $3,200, $2,750, and $2,350
Ethereum Technical Analysis
The analysis of Ethereum against the Tether on the weekly timeframe shows that the price is currently attempting a base above the upper boundary of the Bollinger Bands, as the pair displays a signal of strength and volatility expansion.
However, the MACD line is above the signal line, and both are in positive territory, with growing histogram bars, showing rising bullish momentum as participation for the week increased, validating the upward move.
As it stands, if Ethereum can build $3,500, the $4,300 may be the next target.
ETH/USDT Analysis: Building a Strong Base for Potential Upside
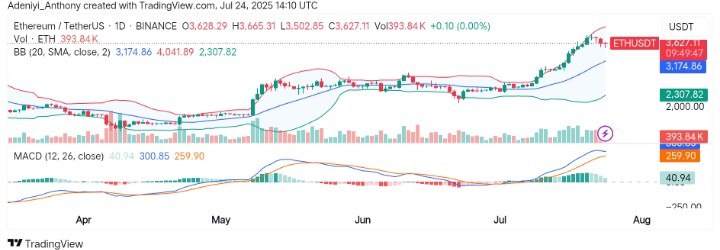
For the past few days, ETH/USDT on the daily timeframe has been showing a strong move, closing at $3,630 and confirming bullish pressure. However, the price appears to be trading just below $4,042, signaling upward strength and volatility.
However, the MACD is still bullish but appears to be stalled. To this end, the volume supports a growing upside. To this end, a short-term pullback towards the $3,175 level may offer a good entry before the next upward leg towards $4,300.
You can purchase crypto coins here. Buy LBlock