Ethereum Remains Inside a Range but Moves Above $3,000
Estimated Reading Time: 2 minutes
Don’t invest unless you’re prepared to lose all the money you invest. This is a high-risk investment and you are unlikely to be protected if something goes wrong. Take 2 minutes to learn more

Ethereum Price Long-Term Analysis: Bearish
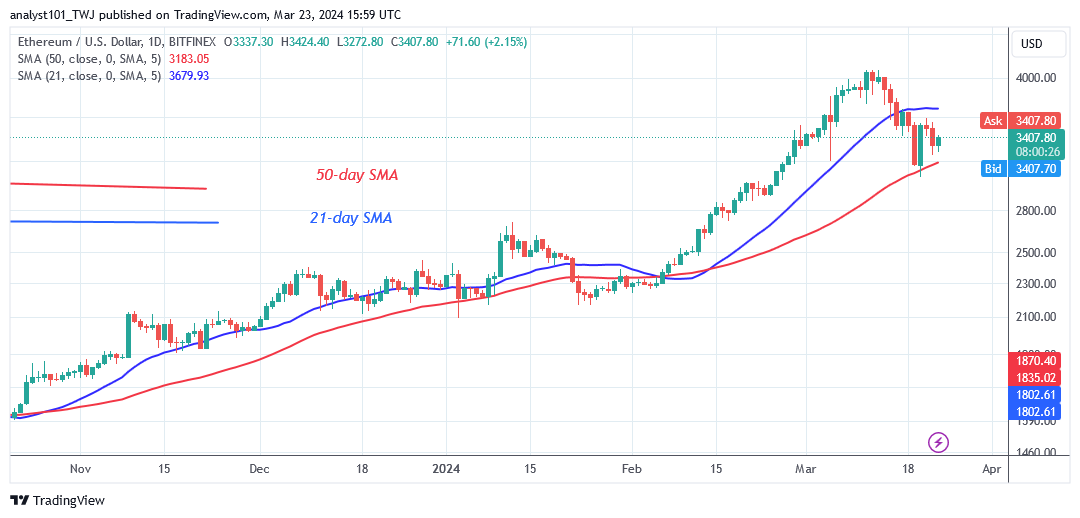
Ethereum’s (ETH) price has fallen between the moving average lines but moves above $3,000. Neither the bulls nor the bears broke the moving average lines. On March 19, bears failed to breach the 50-day SMA, while bulls halted the slide. Bulls failed twice at the 21-day SMA and were repulsed. This has led to increased price volatility between the moving average lines.
Today, the most popular altcoin is correcting upward and is in the middle of the moving average lines. On the upside, a break above the 21-day SMA, or $3,695.60, will accelerate the altcoin’s advance above the psychological price milestone of $4,000. If buyers fail to break above the previous high, the present oscillation between the moving average lines will continue.
Technical indicators:
Major Resistance Levels – $3, 600, $3,800, $4,000
Major Support Levels – $2.600, $2, 400, $2,200
Ethereum Indicator Analysis
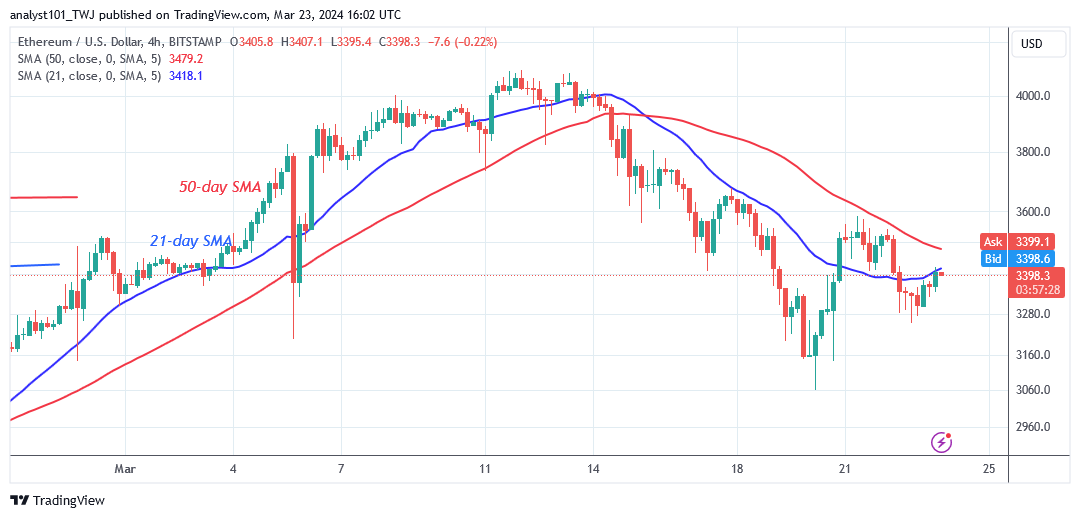
Ethereum’s price bars remain caught between the moving average lines. Price variations have remained unabated between the moving average lines. Despite the recent dip, the moving average lines continue to point northward.
Conclusion
The largest altcoin is now trading in a range but moves above $3,000. Since March 19, 2024, the price has fluctuated between $3,150 and $3,600. The price movement has been dominated by Doji candlesticks, causing the altcoin to remain stationary. The crypto signal has remained range-bound, with bulls holding the decline above the $3,000 support.
You can purchase Lucky Block here. Buy LBLOCK
Note: Cryptosignals.org is not a financial advisor. Do your research before investing your funds in any financial asset or presented product or event. We are not responsible for your investing results