Lucky Block (LBLOCK/USD) Market Forms Bullish Trend With Rising Momentum Levels
Estimated Reading Time: 3 minutes
Don’t invest unless you’re prepared to lose all the money you invest. This is a high-risk investment and you are unlikely to be protected if something goes wrong. Take 2 minutes to learn more

Lucky Block Price Forecast – December 9
The LBLOCK/USD market forms a bullish trend with rising momentum levels. Following the recent buy-side liquidity grab, a run through the premium zone is probably after the ongoing short-term retracement ends.
The MACD (Moving Average Convergence Divergence) clearly indicates increasing buying pressure, as the MACD line has crossed above the signal line, confirming a positive trend. The SMA (Simple Moving Average) at $0.00001950 serves as a dynamic support level, with LBLOCKUSD above it, indicating the bulls’ dominance. These indicators collectively highlight the continuity of sustained upward movement in the LBLOCKUSD market.
LBLOCK/USD Market Key Levels:
Resistance levels: $0.00002490, $0.00002990, $0.00003500
Support levels: $0.00001880, $0.00001600, $0.00001000
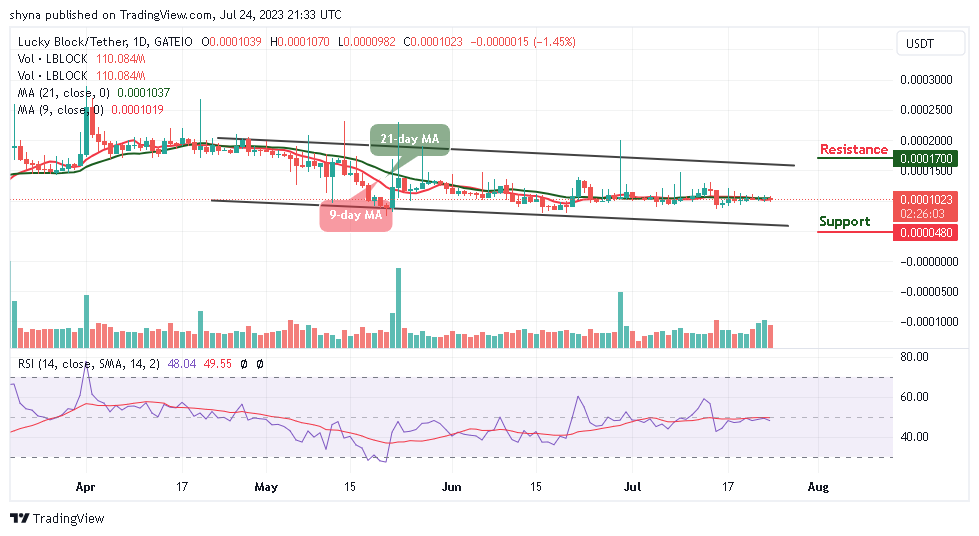
LBLOCK/USD – Daily Chart
The daily chart for LBLOCK/USD reveals that the market’s order flow remains bullish as a break of structure recently occurred.
The price action showcases a breakout above the resistance level of $0.00002130 after a period of consolidation. This movement followed the formation of a bullish divergence, signaling a reversal from recent lows around $0.00001600. The chart also reveals a breach of the buy-side liquidity (BSL) level, reinforcing the bullish outlook as buyers gain control of the market momentum.

What is expected of LBLOCK/USD in the coming days?
Looking forward, LBLOCKUSD is projected to retrace slightly to $0.00002130, which now acts as support, before continuing its upward trajectory. The next major target lies at $0.00002490, with further bullish pressure potentially extending the rally to $0.00002990.

LBLOCK/USD – Four-Hour Chart
LBLOCKUSD shows a gradual uptrend supported by a rising trendline, with the price currently trading above $0.00002070, which acts as a dynamic support. The MACD is approaching a bullish crossover, signaling potential upward momentum.
A bounce from $0.00001900 could propel the price toward the resistance levels at $0.00002200 and $0.00002490. A breakout above $0.00002490 may confirm a bullish continuation toward $0.00002990.
Lucky Block (LBLOCK) Current Statistics
The current price: $0.00002130
Market Capitalization: $1,570,000
Trading Volume: $6,250
Do you need a coin that will 100X soon? Get LBLOCK here