Lucky Block (LBLOCK/USD) Market Outlook Points Toward a Bullish Breakout Soon
Estimated Reading Time: 3 minutes
Don’t invest unless you’re prepared to lose all the money you invest. This is a high-risk investment and you are unlikely to be protected if something goes wrong. Take 2 minutes to learn more

Lucky Block Price Forecast – October 22
The Lucky Block market outlook points toward a bullish breakout soon. A retraction from the bullish order block is expected to cause a massive surge into the premium zone.
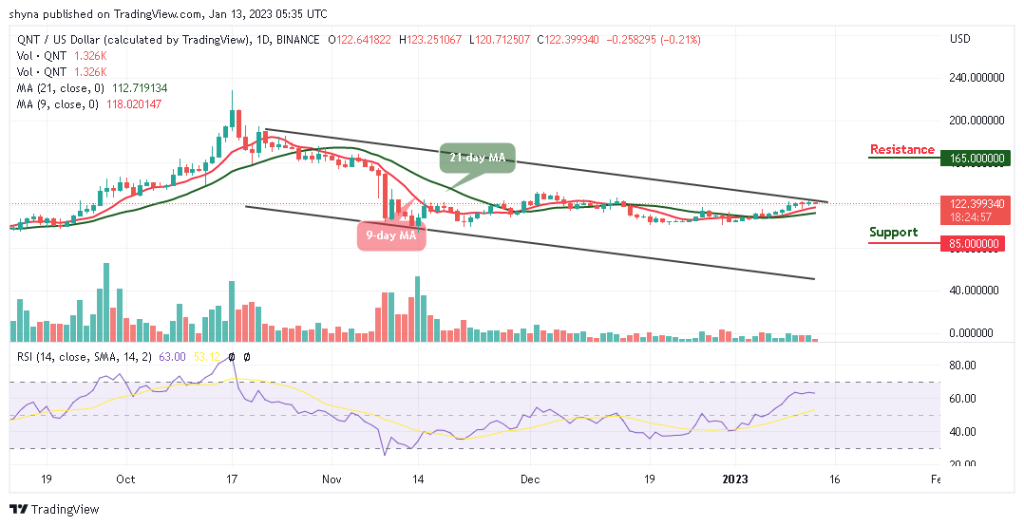
The indicators on the LBLOCKUSD chart suggest a potential bullish momentum. The RSI is currently at 48.70, slightly below the neutral 50 level, which indicates a possible upward shift as buying pressure increases. The price is trading close to the 9-day moving average of $0.00002140, which provides short-term support and highlights a trend reversal potential. If buyers sustain their momentum, the RSI could push higher, leading to more aggressive buying.
LBLOCK/USD Market Key Levels:
Resistance levels: $0.00002490, $0.00002990, $0.00003940
Support levels: $0.00001880, $0.00001600, $0.00001000
LBLOCK/USD – Daily Chart
The daily chart for LBLOCK/USD shows that the price is set for a massive surge as it approaches a bullish order block.
In terms of price action, LBLOCKUSD has shown consolidation around the $0.00002100 to $0.00002140 range. The chart shows multiple rejections around the $0.00002490 resistance, indicating a key level that needs to be broken for further upside.
However, the recent retest of the order block (OB) at $0.00001880 suggests strong support, making it an attractive entry point for buyers. The presence of higher lows since mid-September shows that the market is preparing for a breakout.

What is expected of LBLOCK/USD in the coming days?
The projection for Lucky Block is bullish, with a target of $0.00002990 in sight if the price breaks above the $0.00002490 resistance level. A successful breach could drive the pair towards $0.00003940, its next major resistance.
However, failure to break this zone might lead to another consolidation phase around $0.00002140 before an upward surge. The overall market structure supports a bullish trend, with possible gains in the near term.

LBLOCK/USD – Four-Hour Chart
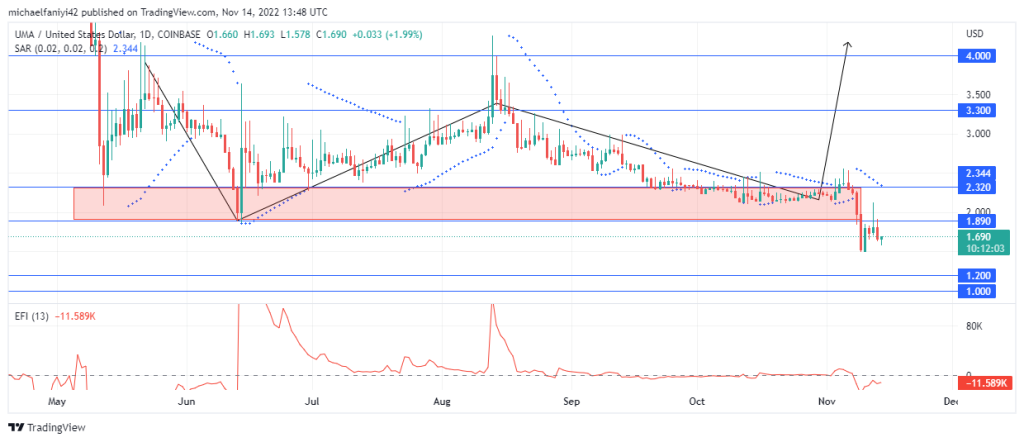
LBLOCKUSD is showing bullish signs with the price above the $0.00002060 support level. The 9-period moving average of $0.00002150 is being tested as a potential support zone, indicating short-term momentum could push prices higher.
A breakout above the $0.00002490 resistance would confirm a strong upward move toward $0.00002990. The RSI at 49.39 is neutral but inching toward 50, signaling a potential increase in buying pressure.
Lucky Block (LBLOCK) Current Statistics
The current price: $0.00002140
Market Capitalization $1,670,000
Trading Volume: $2280
Do you need a coin that will 100X soon? Get LBLOCK here