Lucky Block (LBLOCK/USD) Market Set For Bullish Momentum After Breakout
Estimated Reading Time: 2 minutes
Don’t invest unless you’re prepared to lose all the money you invest. This is a high-risk investment and you are unlikely to be protected if something goes wrong. Take 2 minutes to learn more

Lucky Block Price Forecast – October 7
The Lucky Block market is set for bullish momentum after the breakout. The currently formed bullish marubozu candlestick indicates increasing bullish momentum.
The LBLOCKUSD chart is showing positive signs across key indicators. The price is currently above the 9-day simple moving average (SMA) at $0.00002400, signaling upward momentum. Additionally, the stochastic oscillator is rising from oversold conditions, with a value of 52.16, indicating potential bullish strength in the short term.
LBLOCK/USD Market Key Levels:
Resistance levels: $0.00002490, $0.00003000, $0.00004000
Support levels: $0.00001880, $0.00001600, $0.00001000
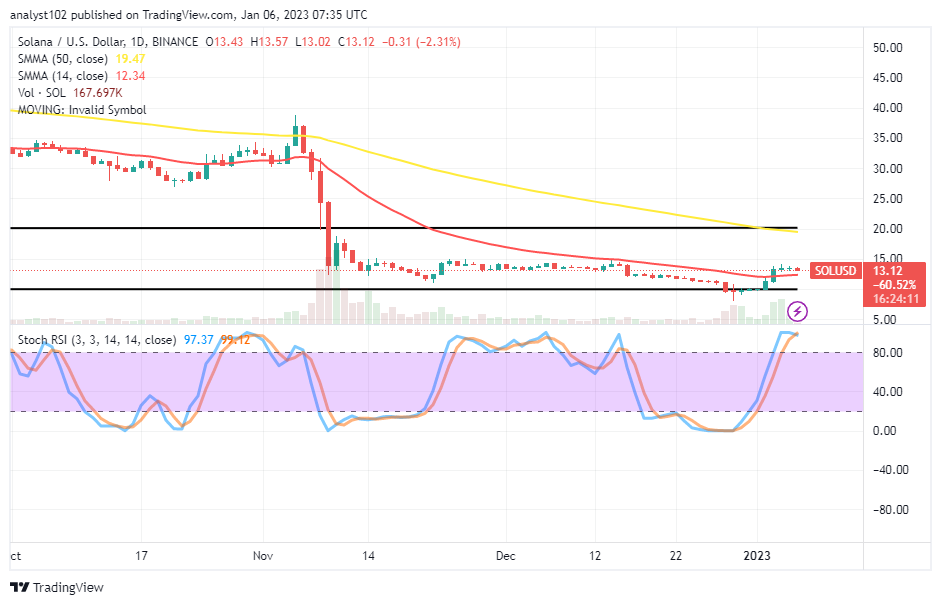
LBLOCK/USD – Daily Chart
The daily chart for LBLOCK/USD shows that the market’s overall trend remains bullish.
The price action shows a clear breakout from a descending structure around $0.00002490, which previously acted as resistance. After the breakout, LBLOCKUSD retraced slightly, finding support near $0.00002400, reinforcing this level as a strong base. This upward push marks a break of structure (BOS), signaling a shift in market sentiment toward the bulls.

What is expected of LBLOCK/USD in the coming days?
Projections suggest a continued bullish movement, with an initial target of $0.00002990. If this level is broken, the price could continue into the $0.00004000 zone. A pullback to the $0.00002400 support area may occur before another bullish leg.

LBLOCK/USD – Four-Hour Chart
LBLOCKUSD has broken above the descending trendline at $0.00002240, signaling bullish momentum. The price is trading above the 9-period moving average, with support at $0.00002240 holding firm.
The Stochastic Oscillator is rising sharply from oversold territory, with a reading of 68.35, indicating further upside potential. The next key resistance is at $0.00002490, with a target of $0.00002900 if the bullish momentum continues.
Lucky Block (LBLOCK) Current Statistics
The current price: $0.00002420
Market Capitalization: $1,790,000
Trading Volume: $2140
Do you need a coin that will 100X soon? Get LBLOCK here