Lucky Block (LBLOCK/USD) Market Shows Bullish Potential With Strong Support Levels
Estimated Reading Time: 3 minutes
Don’t invest unless you’re prepared to lose all the money you invest. This is a high-risk investment and you are unlikely to be protected if something goes wrong. Take 2 minutes to learn more

Lucky Block Price Forecast – October 28
The LBLOCK/USD market shows bullish potential with strong support levels. The selling momentum declines as the price approaches the major support at $0.00002490.
The LBLOCKUSD market has been demonstrating signs of bullish potential, as indicated by key technical indicators. The Stochastic Oscillator, currently hovering near the oversold zone around 30, suggests a potential upward momentum as it begins to curve upward. Additionally, the 9-day Simple Moving Average (SMA) is stabilizing close to the price action, indicating consolidation and a possible bounce higher if buying pressure increases.
LBLOCK/USD Market Key Levels:
Resistance levels: $0.00002490, $0.00002990, $0.00003500
Support levels: $0.00001880, $0.00001600, $0.00001000
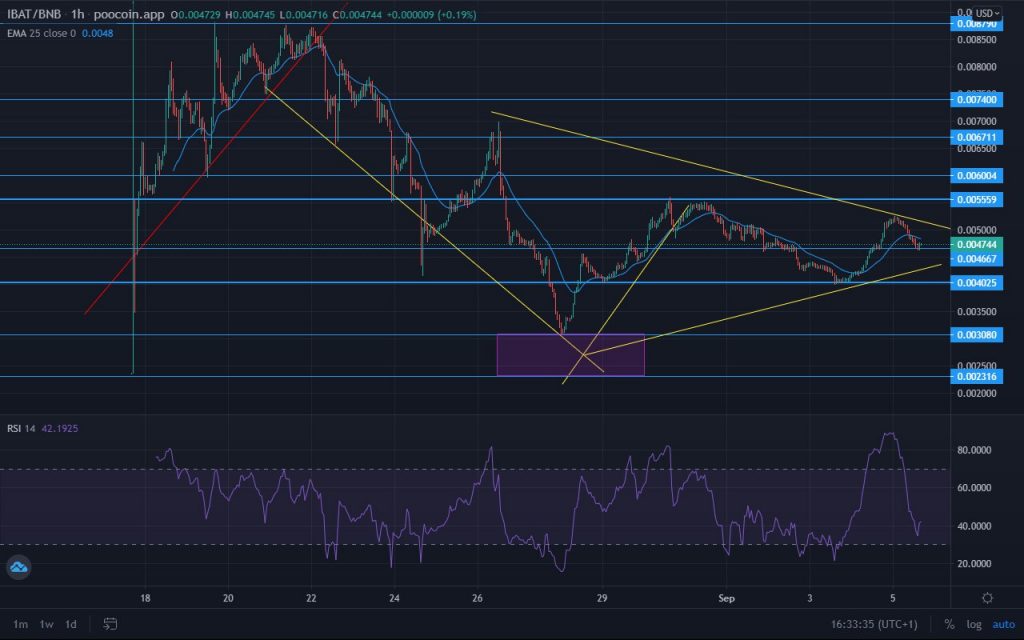
LBLOCK/USD – Daily Chart
The daily chart for LBLOCK/USD shows that the market is building momentum for a potential rally.
LBLOCKUSD has respected a critical support level around $0.00001880, with price consistently bouncing off this area. This level serves as a significant demand zone, as shown by the Order Block (OB) around the same level.
Recent price movements have maintained this support, suggesting buyer interest at these levels. The repeated rejections near the $0.00002160 level indicate consolidation before a potential breakout.

What is expected of LBLOCK/USD in the coming days?
Looking ahead, if LBLOCKUSD maintains support at $0.00001880, we can anticipate an upward move towards the next resistance level at $0.00002990. A breakout above this level may drive the price higher towards $0.00003500, marking the bullish trajectory.

LBLOCK/USD – Four-Hour Chart
The LBLOCKUSD 4-hour chart shows bullish momentum building around the strong support at $0.00001880. The Stochastic Oscillator, currently rising from the oversold region, signals a potential upward movement as buyers regain control.
Price action has been consolidating within a range, indicating an accumulation phase with resistance around $0.00002140. A breakout above this resistance could propel LBLOCKUSD toward the next target at $0.00002490, aligning with the overall bullish outlook.
Lucky Block (LBLOCK) Current Statistics
The current price: $0.00002100
Market Capitalization $1,540,000
Trading Volume: $530
Do you need a coin that will 100X soon? Get LBLOCK here