Lucky Block (LBLOCK/USD) Market Shows Renewed Bullish Sentiment After Recent Consolidation Phase
Estimated Reading Time: 3 minutes
Don’t invest unless you’re prepared to lose all the money you invest. This is a high-risk investment and you are unlikely to be protected if something goes wrong. Take 2 minutes to learn more

Lucky Block Price Forecast – August 11
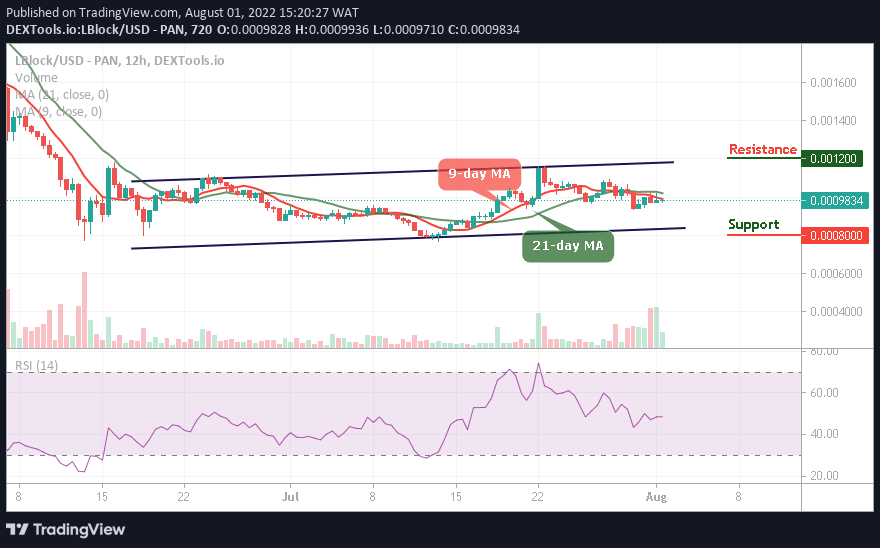
LBLOCK/USD Market shows renewed bullish sentiment after recent consolidation phase. LBLOCKUSD has exhibited a notable shift in market sentiment, moving from a prolonged downward drift into a phase of renewed upside potential.
The recent recovery above the 9-day SMA at $0.00003300 signals strengthening bullish momentum, with the RSI reading of 46.67 indicating room for further appreciation before overbought conditions emerge. This alignment between price and key momentum indicators reflects an emerging market readiness to extend gains.
LBLOCK/USD Market Key Levels:
Resistance levels: $0.00007460, $0.00008420, $0.00009690
Support levels: $0.00003190, $0.00003000, $0.00002000

LBLOCK/USD – Daily Chart
The daily chart of LBLOCKUSD is rebounding off a major demand zone at $0.00003000.
The asset has successfully reclaimed support at $0.00003190 after briefly dipping below it, confirming the zone between $0.00003110 and $0.00003300 as a robust demand base. Price action has also filled the earlier fair value gap (FVG) and maintained upward structure, with recent candles showing reduced selling pressure. The consistent defense of these levels suggests buyers are regaining control, positioning the market for a sustained upward move.
What is the market outlook of LBLOCK/USD?
Looking ahead, a decisive close above the $0.00004160 level could catalyze further acceleration toward the mid-term resistance at $0.00007460. If buying momentum persists, the bullish trajectory may extend to $0.00008420, with an ambitious upside target of $0.00009690 in the medium term. However, maintaining price action above $0.0000330 remains critical to safeguarding this bullish outlook and avoiding a potential retest of the $0.00003000 zone.

LBLOCK/USD – Four-Hour Chart
LBLOCKUSD has regained upward momentum on the four-hour chart after a confirmed change of character (CHoCH) above the previous bearish structure. Price is consolidating above the $0.00003290 support level, with the 9-period SMA at $0.00003440 acting as dynamic support.
RSI at 56.46 indicates moderate bullish strength, leaving room for further upside before overbought conditions. A breakout above $0.00004160 could accelerate buying pressure toward the $0.00005000 area.
Lucky Block (LBLOCK) Current Statistics
The current price: $0.00003440
Market Capitalization: $2,580,000
Trading Volume: $14,240
Do you need a coin that will 100X soon? Get LBLOCK here