POL (prev. MATIC) Price Prediction: POL/USDT Deviates From Its Recent Bounce
Estimated Reading Time: 3 minutes
Don’t invest unless you’re prepared to lose all the money you invest. This is a high-risk investment and you are unlikely to be protected if something goes wrong. Take 2 minutes to learn more
Date: October 4, 2025
Lately, the POL (previously MATIC) market has seen an upward rebound off the $0.2100 price level. The rebound extended over several sessions and moved past some key technical levels. Although the ongoing session has posted a downward deflection, the market remains generally afloat.
POL/USDT Long-Term Trend — Bullish (Daily Chart)
Key Price Levels:
Resistance: $0.2400, $0.2800, $0.3200
Support: $0.2100, $0.1800, $0.1600
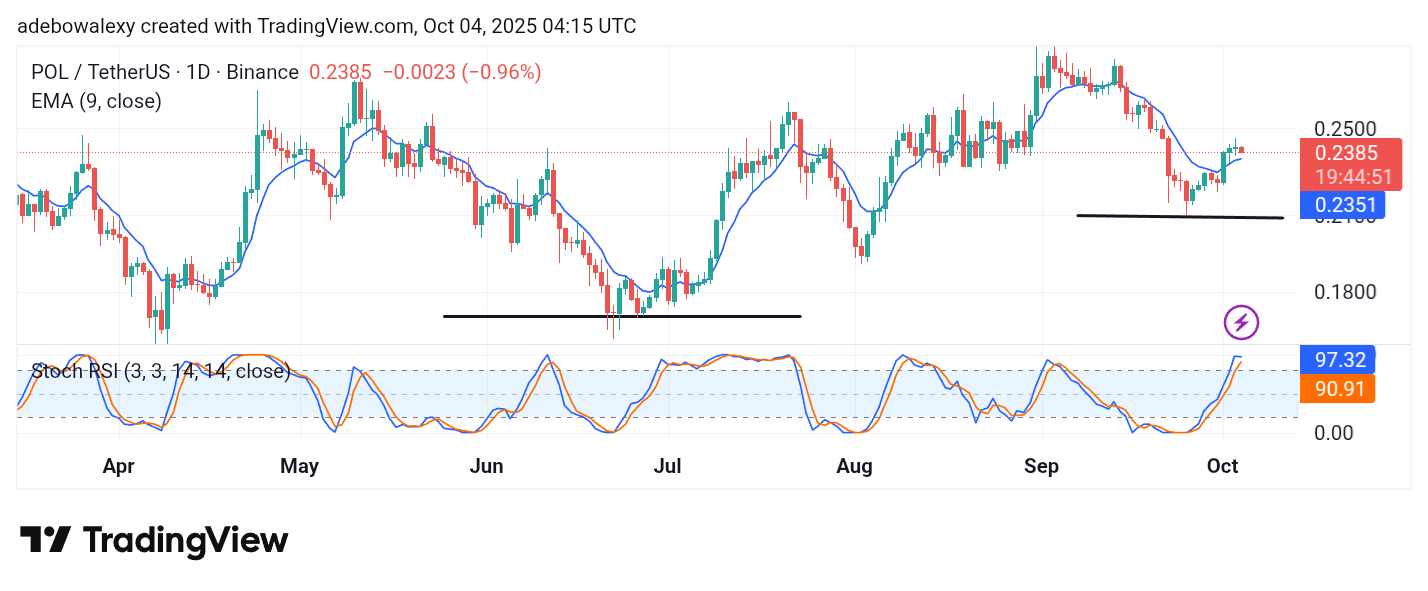
Price action in POL (previously MATIC) has moved upward from solid support at the $0.2100 level. However, the ongoing session shows a downward orientation, appearing red and prominent. Nevertheless, it remains above the 9-day Exponential Moving Average (EMA) curve. The Stochastic Relative Strength Index (SRSI) indicator lines have reached the overbought region. The lead line shows a deflection in response to the price dip in the ongoing session.
POL/USDT Price Prediction: POL (prev. MATIC) Has a Strong Base for Continuation
Price activity in the POL (prev. MATIC) market has experienced a modest upward movement from the $0.2100 level. However, it appears the market has started to face some difficulty progressing upward over the past two sessions as momentum dwindles, leading to a downward retracement in the ongoing session.
This suggests a mild yield to bearish pressure, though the market remains above the 9-day EMA line. The SRSI indicator lines are still in the overbought region but show a deflection, which colors the market outlook and suggests caution among traders at the moment.
POL/USDT Price Prediction: POL (prev. MATIC) Downward Forces Face Resistance (4-Hour Chart)
On the POL (prev. MATIC) 4-hour price chart, price action has descended below the 9-day EMA line. In the ongoing session, it appears that price movement is already facing some resistance, as indicated by the appearance of a heavily compressed price candle.
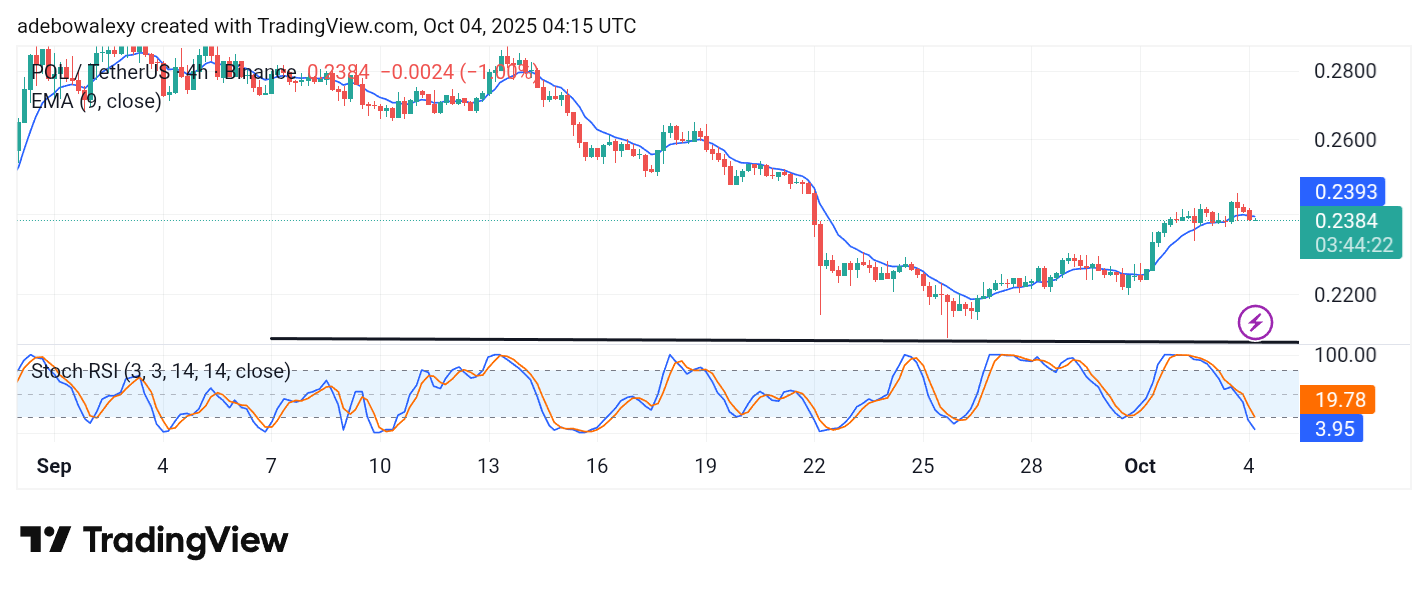
However, this candle stands below the 9-day EMA curve. Meanwhile, the SRSI line has descended deep into the oversold region despite the moderate price decline. This suggests that downward forces might be weakening and that an upward rebound may soon occur toward the $0.2500 price level.