Polkadot (DOT/USDT) Slides into Oversold Zone Amid Short-term Bounce Expectation
Estimated Reading Time: 3 minutes
Don’t invest unless you’re prepared to lose all the money you invest. This is a high-risk investment and you are unlikely to be protected if something goes wrong. Take 2 minutes to learn more
Polkadot Long-term Analysis: Bearish
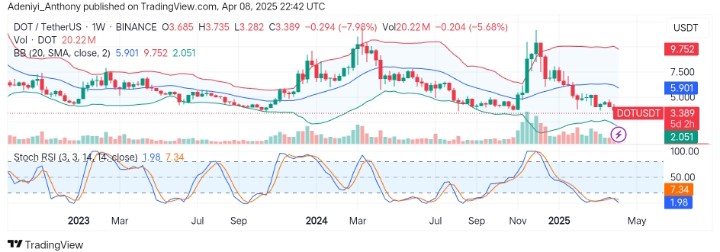
In the past few weeks, Polkadot against the Tether has shed significant value, moving southward from its former height above the $9.000 level. This can be seen in the steady decline experienced by the pair, as the price breaks below the dynamic line of the Bollinger band on a weekly timeframe.
However, in recent times, the decreasing volume and the positioning of the price line deep in the oversold region of the indicators used in this analysis suggest the possibility of a bounce in the short term or a continuation of the current trend.
Currently, Polkadot trades at $3.389, recording over 7% loss for the week already.
Technical Indicators
Major Resistance Levels: $4.500, $5.900, and $9.750
Major Support Levels: $3.000, $2.050, and $1.800
Polkadot Technical Analysis
On the weekly timeframe, Polkadot against the Tether appears to be moving southeast, indicating an extreme move by the sellers as the price breaks below the dynamic moving average of the Bollinger Bands. The declining volume indicates decreasing buying interest. However, can the market bounce in favor of the bulls as the price approaches the oversold region?
From another angle, the Stochastic RSI indicates the pair is oversold as the value of the blue reads 1.96. Though this might signal a potential short-term bounce is imminent. However, without a crossover signal from the lines, an extension of the bearish run would be witnessed.
To this end, the $3.000 support level looks like a nice re-entry point for the buyers; otherwise, a break below this level would suggest a continuation of bearish dominance.
DOT/USDT Analysis: What’s Next?
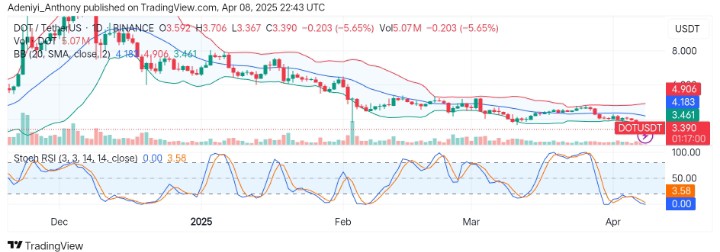
On the daily chart, DOT/USDT is experiencing prolonged bearish momentum, as the price remains tightly pressed against the lower Bollinger band. On the other hand, the daily volume shows low conviction from the bears, as the price movement suggests the bulls are preparing for a little bounce to the north.
However, the Stochastic RSI, on the other hand, shows an extreme oversold condition with no reversal, as the blue line becomes flat with a 0.00 value.
To this end, as the bullish traders hope for a bounce, the 4.183 dynamic band is a major resistance level, and failure to break above $3.460 would keep the bears in control of the market.
You can purchase crypto coins here. Buy LBlock