Raydium (RAY/USD) Breaks Above $2.00 – Is a New Bull Run Underway?
Estimated Reading Time: 3 minutes
Don’t invest unless you’re prepared to lose all the money you invest. This is a high-risk investment and you are unlikely to be protected if something goes wrong. Take 2 minutes to learn more
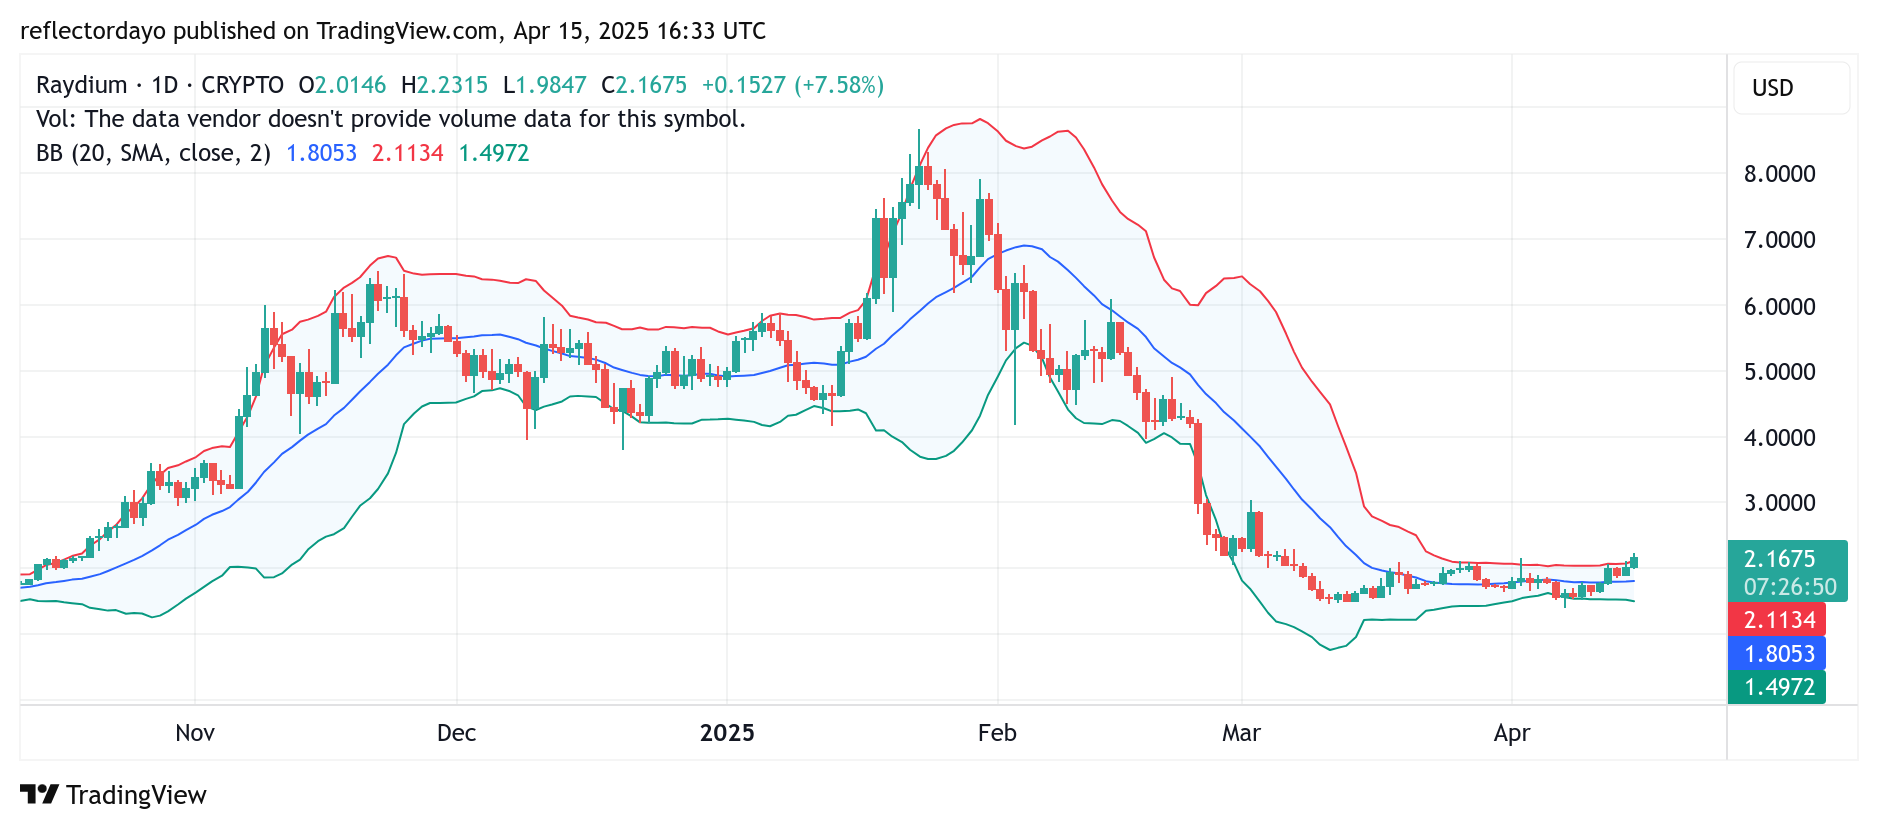
Raydium has just surged above the critical $2.00 price level, potentially signaling the start of a new bullish trend. This level has served as a major resistance point during the prolonged consolidation phase that has persisted for some time. Today’s bullish momentum was strong enough to break through and flip this resistance into potential support. As some investors begin to take profits, the price is now undergoing a correction. If the $2.00 level holds, it could confirm its new role as a support zone and strengthen the case for a sustained upward move.
Raydium Market Data
- RAY/USD Price Now: $2.04
- RAY/USD Market Cap: $603 million
- RAY/USD Circulating Supply: 554 million RAY
- RAY/USD Total Supply: 290 million RAY
- RAY/USD CoinMarketCap Ranking: #89
Key Levels
- Resistance: $2.50, $3.00, and $3.50
- Support: $1.30, $1.20, and $1.10
Technical Outlook on Raydium
Breaking above the $2.00 price level marks a significant achievement for Raydium bulls. However, when this price action is analyzed alongside the trading volume indicator, a different narrative emerges. The lack of strong volume undermines the credibility of the current bullish breakout, suggesting that the upward move may not be fully supported by market participation.
From an optimistic standpoint, the trading volume could begin to show strength in upcoming sessions as new investors are drawn to the market. For now, the crypto signal is undergoing a correction, which may prompt some traders to adopt a cautious stance as they monitor how the market reacts around the critical $2.00 threshold.
RAY/USD 4-Hour Chart Analysis
A closer look at the 4-hour chart provides a more detailed view of the market dynamics. After breaking above the $2.00 price level, Raydium entered a phase of indecision, as indicated by the appearance of several doji candlesticks. Despite this uncertainty, the market managed to push further, eventually reaching a high of $2.185.
However, a price correction followed as supply slightly outweighed demand, likely due to profit-taking by some traders. The market’s sluggish behavior above this level may explain the cautious sentiment among some investors. That said, if the price retraces and holds above the $2.00 mark, it could reignite bullish momentum in the near term.