Sei Market (SEI/USD) Bullish Recovery Reclaims $0.27—Poised to Flip into Support
Estimated Reading Time: 3 minutes
Don’t invest unless you’re prepared to lose all the money you invest. This is a high-risk investment and you are unlikely to be protected if something goes wrong. Take 2 minutes to learn more

The Sei market (SEI/USD) has been in a sustained downtrend since peaking above the $1.00 mark last year. A series of lower highs and consistent selling pressure have defined the bearish momentum, with the last significant high recorded near $0.80 in December.
Since then, bears have maintained control, driving the price downward until it reached a potential bottom around the $0.14 level in early April. This low marked the emergence of a notable support zone, which appears to have sparked a gradual recovery.
Following this support, the market has begun to form higher lows, indicating a shift in momentum. The recent rebound has now pushed SEI/USD above the $0.27 level—a critical zone that may now act as a new support if sustained. This crypto signal development suggests a possible trend reversal and invites further bullish interest if the support holds.
The Sei Market Data
- SEI/USD Price Now: $0.28
- SEI/USD Market Cap: $1.5 billion
- SEI/USD Circulating Supply: 5.6 billion SEI
- SEI/USD Total Supply: 10 billion SEI
- SEI/USD CoinMarketCap Ranking: #53
Key Levels
- Resistance: $0.30, $0.35, and $0.40
- Support: $0.20, $0.15, and $0.10
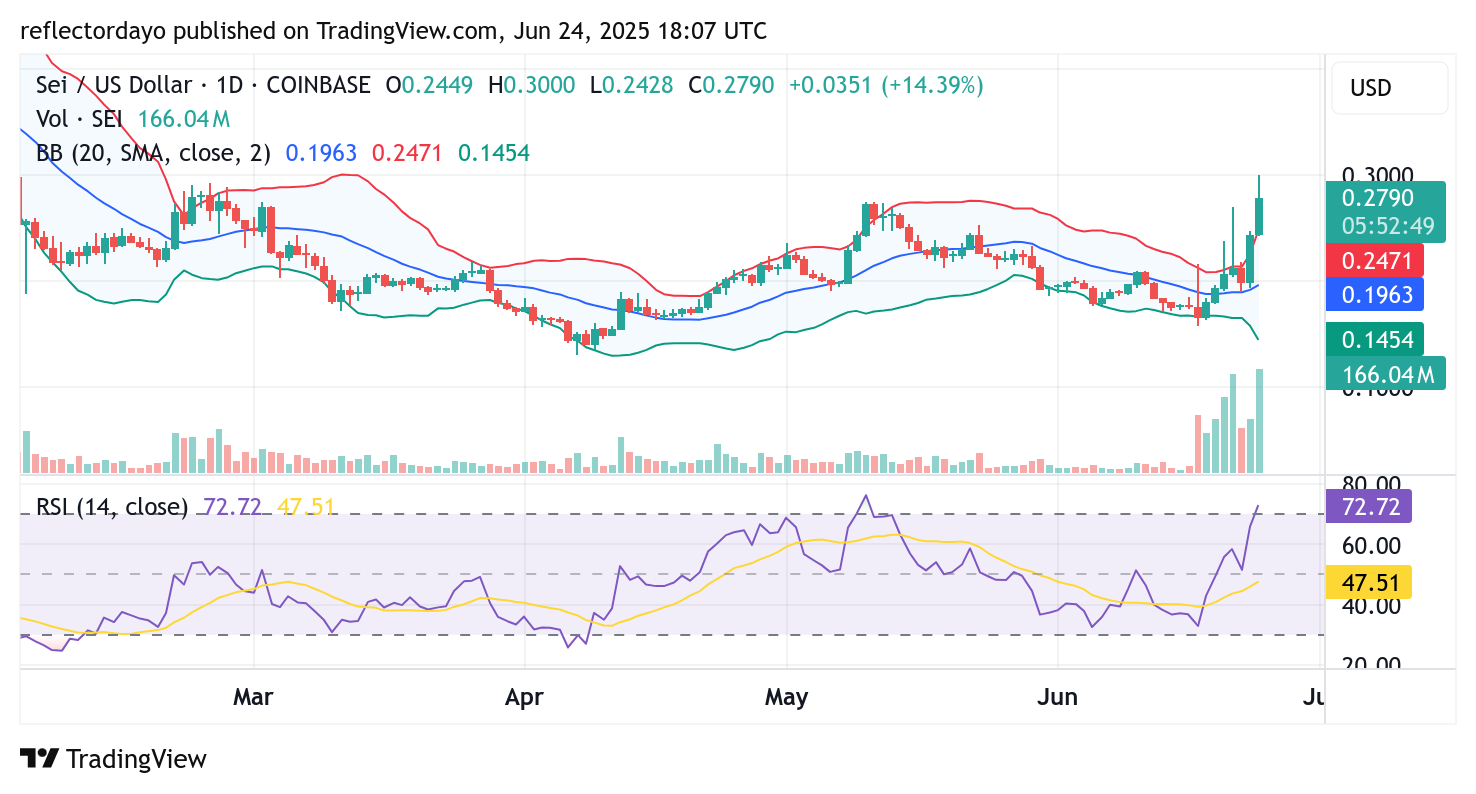
Sei (SEI/USD) Defies Market Downturn, Builds Momentum Above Key Support
Despite the recent crypto market sell-off that pushed several assets to new lows, SEI/USD has shown remarkable resilience. Instead of following the broader market’s downward trend, SEI saw a sharp uptick in trading volume, signaling a clash of market sentiment and growing bullish interest.
Although technically positioned to be vulnerable during the downturn, SEI/USD withstood the pressure and surged upward. The increasing volume—particularly the notable histogram spikes—has lent strong credibility to the ongoing bullish recovery. Fueled by aggressive buying, the price rallied toward the $0.30 level, where it briefly peaked before undergoing a minor correction.
Importantly, this bullish momentum allowed the market to flip the previous resistance at $0.27 into a key support level. While the trade volume suggests a continued upward drive, the Relative Strength Index (RSI) is now reflecting overbought conditions. As a result, the $0.27 zone has become a critical support to watch in the short term, potentially setting the stage for the next bullish leg—should sentiment remain intact.
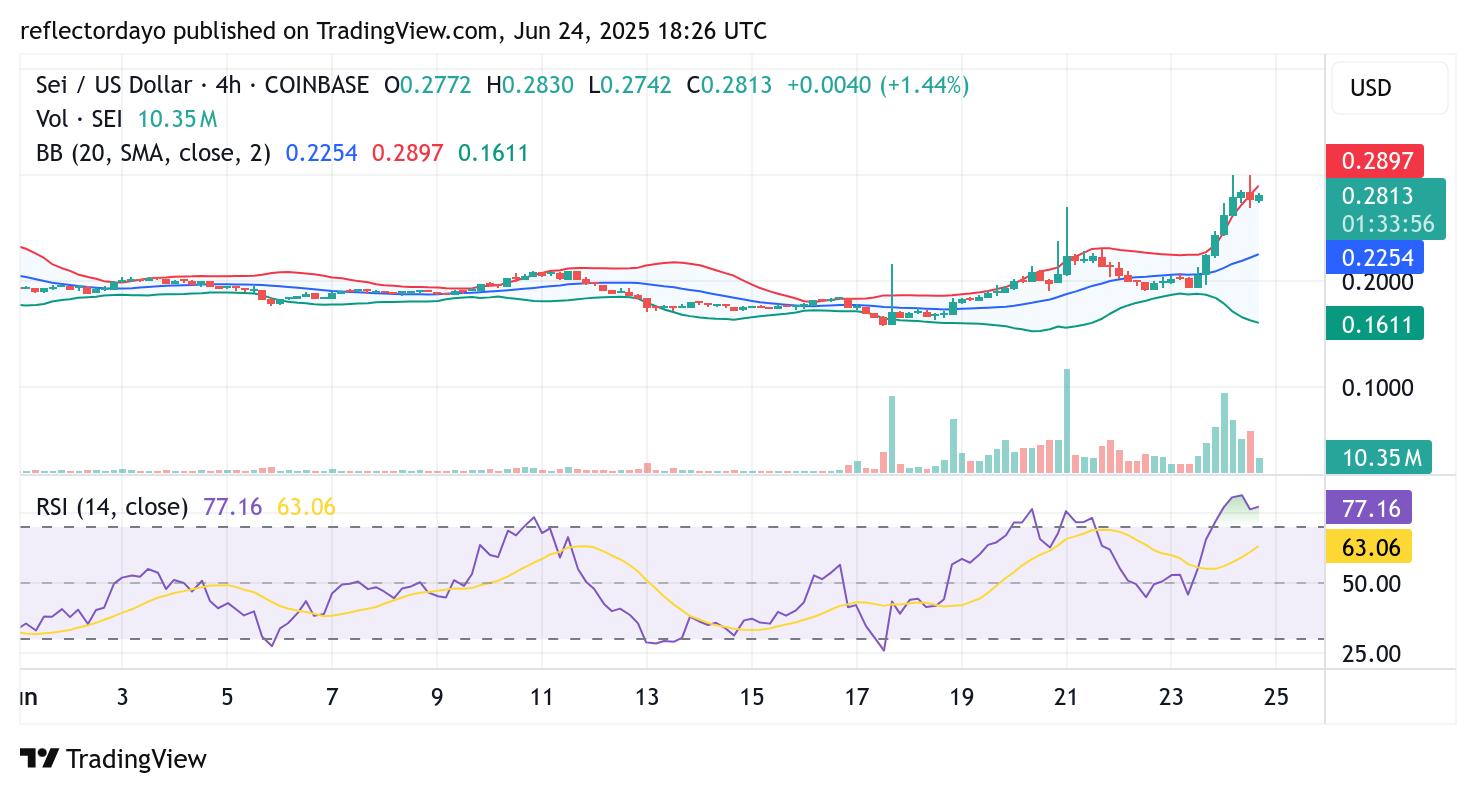
SEI/USD 4-Hour Chart: Price Consolidates at $0.28 as Market Awaits Clear Breakout Direction
Analyzing SEI/USD on the 4-hour chart, the market appears to be entering a consolidation phase around the $0.28 level. At this point, demand and supply are evenly balanced, resulting in reduced trading volume—a common sign of indecision among market participants.
This price standoff suggests that traders are awaiting a clear breakout signal. Notably, the $0.28 zone currently sits within overbought territory according to technical indicators, which increases the risk of a short-term correction. However, if a pullback does not occur, it could indicate growing bullish strength and a potential weakening of bearish sentiment.
Should bulls maintain pressure at this key level, a breakout to the upside becomes increasingly likely, opening the door for further gains in the near term.