$SPONGE (SPONGE/USD): Navigating Market Volatility
Estimated Reading Time: 3 minutes
Don’t invest unless you’re prepared to lose all the money you invest. This is a high-risk investment and you are unlikely to be protected if something goes wrong. Take 2 minutes to learn more

The $SPONGE market remains highly dynamic, with bulls and bears locked in a fierce battle for dominance. Recent developments have seen bearish momentum strengthen, driving the critical support level down from $0.00003 to approximately $0.000025. Despite this downward pressure, the bulls recently attempted to push the price beyond the $0.000055 resistance level. However, a strong rejection at $0.00005 further reinforced bearish control, pulling support to lower levels.
Key Market Levels
- Resistance: $0.00005, $0.000055, $0.00006
- Support: $0.000020, $0.0000195, $0.000019
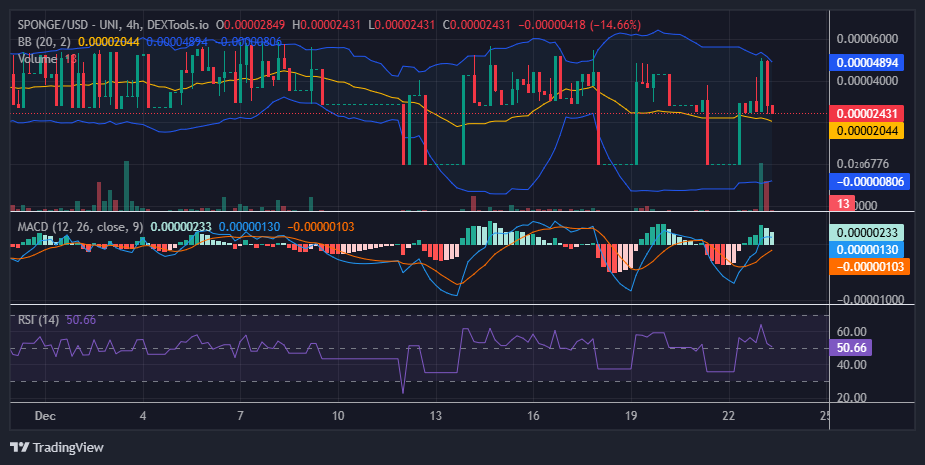
$SPONGE (SPONGE/USD) Technical Analysis
After the recent bearish decline to new lows, bulls mounted a recovery, stabilizing the price near $0.00003. Over the past several 4-hour trading sessions, they managed to hold the $SPONGE price above this crucial support level. However, persistent bearish activity at $0.00003 is chipping away at the bulls’ foothold.
The Bollinger Bands provide a nuanced perspective, with their broad spread signaling high market volatility. This setup suggests that the current bearish trend may lack sustainability unless the price falls below $0.000006. Market participants should closely monitor upcoming sessions for signs of a rebound, as the price could rally past key resistance levels at $0.00005 and $0.000055.
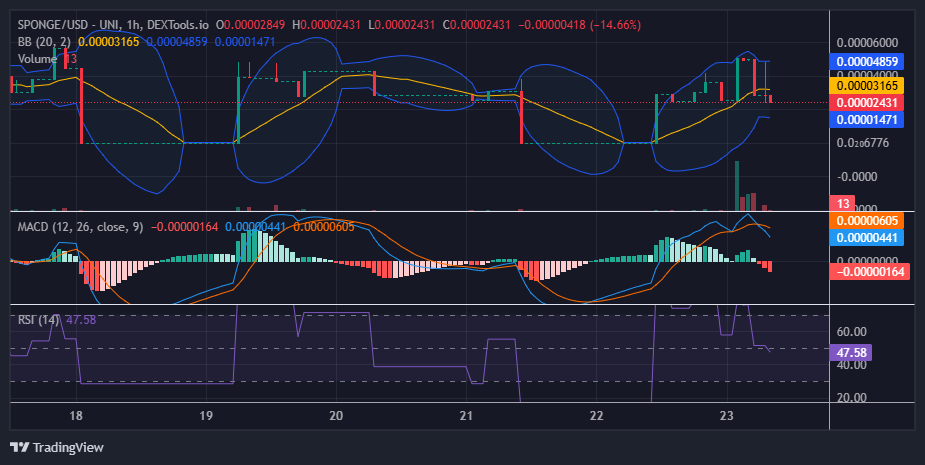
$SPONGE (SPONGE/USD) 1-Hour Chart Overview
On the 1-hour chart, the market appears to be at a standstill, with the price holding steady at $0.000024. This level could act as a springboard for a potential bullish rebound. However, the MACD indicator shows a bearish crossover above the zero line, indicating mounting bearish pressure at this pivotal support level.
While the bears seem to be in control, a confirmed bearish trend has not materialized, as the MACD lines have yet to dip below the zero threshold. Traders should stay alert for signs of a bullish bounce, as the price has demonstrated resilience around this support zone.
Buy SPONGE/USD!
When the family asks if you have a girlfriend yet pic.twitter.com/SIsQt2KfYk
— $SPONGE (@spongeoneth) December 20, 2024
Join the SPONGE community and be part of the next big crypto sensation! Buy Sponge ($SPONGE) today!