$SPONGE (SPONGE/USD) Teeters on the Brink: Is a Breakout Imminent?
Estimated Reading Time: 3 minutes
Don’t invest unless you’re prepared to lose all the money you invest. This is a high-risk investment and you are unlikely to be protected if something goes wrong. Take 2 minutes to learn more

The SPONGE/USD market has been a rollercoaster ride lately, with bulls and bears locked in a fierce struggle. This tug-of-war has created a volatile environment, sending prices swinging wildly. The bears initially gained the upper hand, pushing prices below the crucial $0.000025 support level. This downward pressure dragged the price down to approximately $0.000023.
However, the bears appear to be running out of steam. The market has entered a period of indecision at the $0.000023 level, characterized by the emergence of consecutive doji candlesticks. These indecisive candlesticks suggest a potential shift in momentum. The selling pressure may be waning, and buyers could be preparing to stage a comeback.
This battleground at $0.000023 could be a pivotal moment for SPONGE/USD. Will the bears maintain their grip, or will the bulls break free and propel prices higher?
Key Market Dynamics:
- Resistance Levels: $0.00005, $0.000055, $0.000060
- Support Levels: $0.000020, $0.0000195, $0.000019
$SPONGE (SPONGE/USD) Technical Analysis
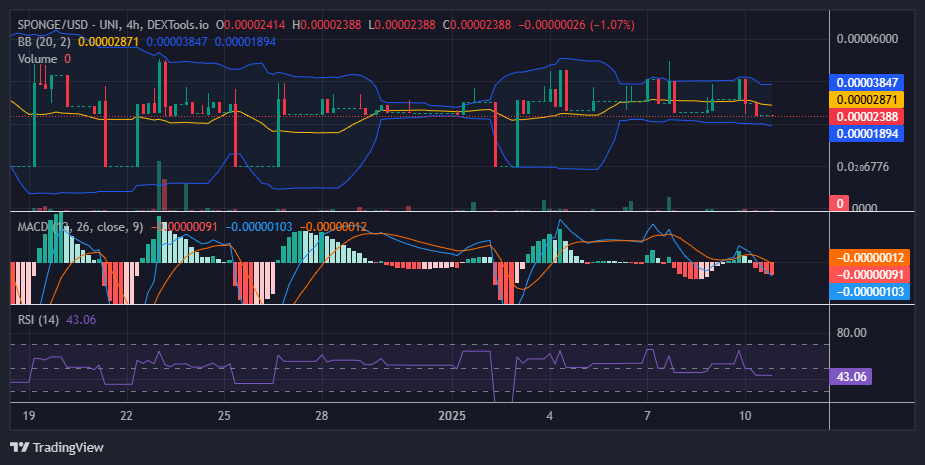
Our previous analysis identified the $0.000025 level as a critical support point. However, the recent bearish onslaught has shifted this support level to approximately $0.000023. At this new support level, the market has entered a state of limbo, with three consecutive doji candlesticks painting a picture of indecision. This crypto pattern often signals a pause in the bearish momentum, indicating potential exhaustion among sellers.
This crossroads presents a critical juncture. Will $SPONGE break below the new support level and continue its downward spiral, or will buyers emerge victorious and initiate a bullish reversal?
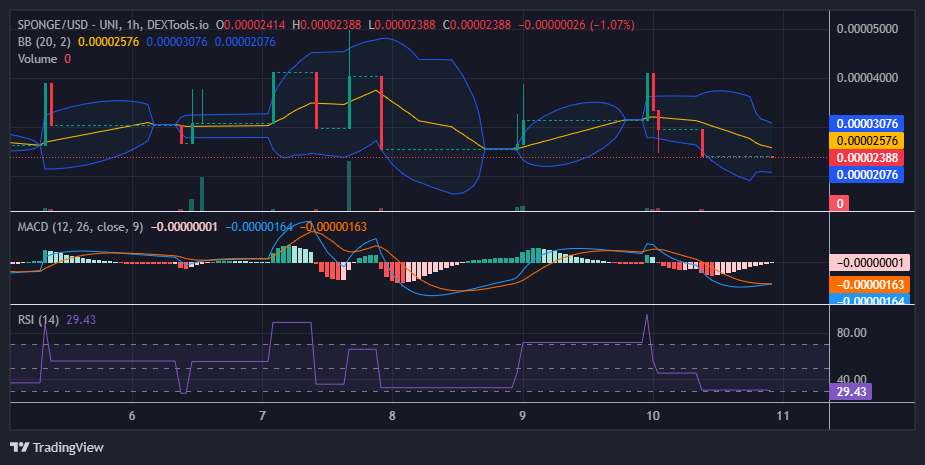
$SPONGE (SPONGE/USD) 1-Hour Chart Observations
Despite the recent bearish pressure, the price has shown resilience at $0.000023. This unexpected strength could be a sign that a bullish rebound is brewing.
The Moving Average Convergence Divergence (MACD) indicator seems to support this notion. The bearish histograms are shrinking, suggesting waning bearish momentum. Furthermore, the MACD lines are approaching a bullish crossover, a signal that often precedes a shift towards bullish momentum.
Adding to the bullish narrative, the Bollinger Bands are gradually converging, indicating a decrease in volatility. This convergence often precedes a significant price move, further increasing the likelihood of a potential rebound.
Buy $SPONGE!
The trenches aren’t for the weak pic.twitter.com/MMJ62WVWWI
— $SPONGE (@spongeoneth) January 8, 2025
Join the SPONGE community and be part of the next big crypto sensation! Buy Sponge ($SPONGE) today!