SPONGE/USD ($SPONGE) Ventures More Into the Demand Zone, Now Is the Time to Make a Good Buy!
Estimated Reading Time: 2 minutes
Don’t invest unless you’re prepared to lose all the money you invest. This is a high-risk investment and you are unlikely to be protected if something goes wrong. Take 2 minutes to learn more
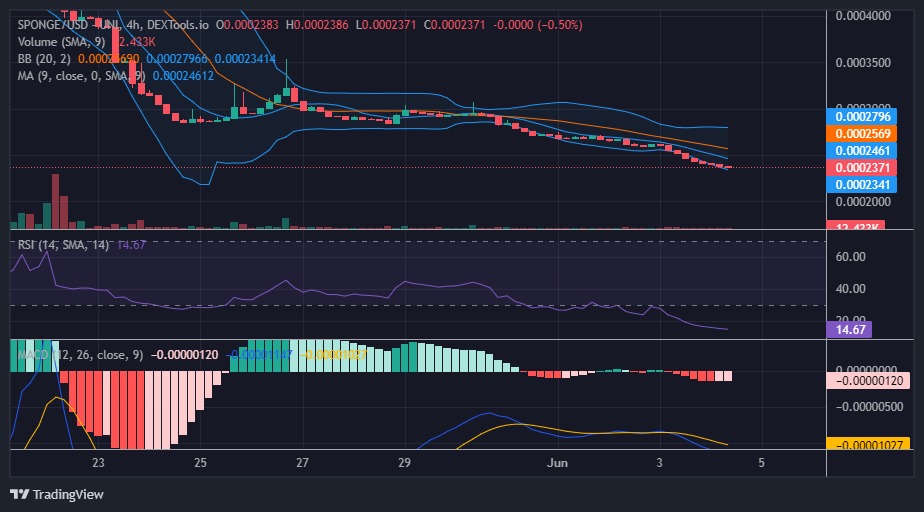
Towards the end of May, the $SPONGE market entered a consolidation trend. The presence of bulls around the $0.0002941 price level was what pegged the bear market that had issued from the $0.00035 price level. After the faceoff between demand and supply at $0.0002941, the market broke out to the downside. However, the bullish presence can still be felt in the market, and that is why the bearish trend appears very slow
Key Levels
- Resistance: $0.00035, $0.00040, and $0.00045
- Support: $0.00022, $0.00020, and $0.00019
SPONGE/USD ($SPONGE) Price Analysis: The Indicators’ Point of View
According to the indicators, the market has slid into the oversold region. Therefore, a price rally is expected to play out in the $SPONGE market. The Relative Strength Index (RSI) now measures very significant selling momentum at level 15. However, the price decline is not steep, meaning that the Sponge bulls are still formidable. The Moving Average Convergence and Divergence (MACD) may just be signaling an upturn in the market, as the negative histograms now turn pale. That means bulls may be gaining strength in the market.
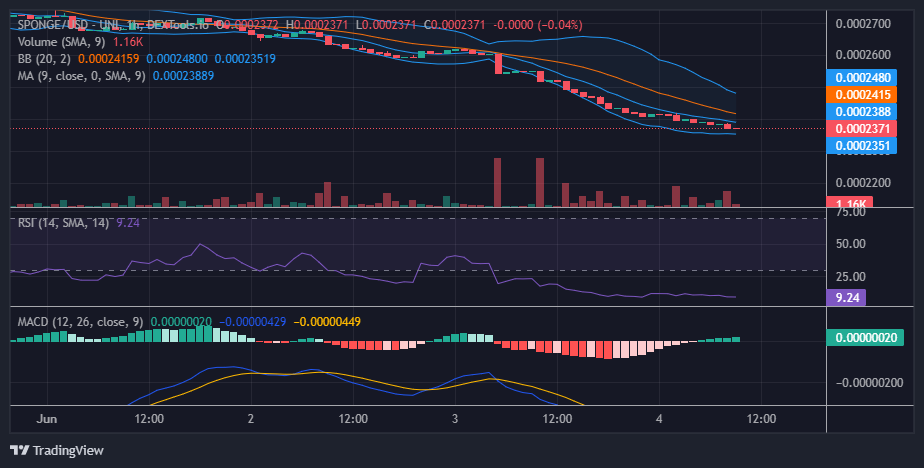
SPONGE/USD Short-Term Outlook: 1-Hour Chart
From a smaller timeframe like this one, it appears like the market is changing direction, and might soon turn to the upside. The Bollinger Bands appear to be contracting because bulls are catching up. Also in the Relative Strength Index, the RSI line appears to be ranging around level 9. The Moving Average Convergence and Divergence (MACD) indicator already has a bullish crossover and positive histograms. Now may be the time to go long.
The SPONGEUSD airdrop is still ongoing. Don’t be left out.
🧽Are you ready to take your place in the $SPONGE #Airdrop rankings! 🏆
🧽Season 1 is going strong! 💪
🧽Earn more points by holding and trading $SPONGE! 💸🔄
🧽Check out the leaderboard today! 📈🔍
🔗 https://t.co/LaiRot6tLJ pic.twitter.com/faACJV3g5H
— $SPONGE (@spongeoneth) June 4, 2023
Invest in the hottest and best meme coin. Buy SpongeBob ($SPONGE) today!