Uniswap (UNI) Price Prediction: UNI/USDT Regains Upside Focus
Estimated Reading Time: 3 minutes
Don’t invest unless you’re prepared to lose all the money you invest. This is a high-risk investment and you are unlikely to be protected if something goes wrong. Take 2 minutes to learn more

Date: July 24, 2025
While the Uniswap market has maintained an upward path for some time, it experienced a dip yesterday as Bitcoin briefly fell below the $118,000 threshold. However, today’s trading activity has returned the market to its previous bullish trajectory.
Uniswap (UNI) Price Prediction: UNI/USDT Long-Term Trend — Bullish (Daily Chart)
Key Price Levels:
Resistance: $11, $13, $15
Support: $10, $9, $8
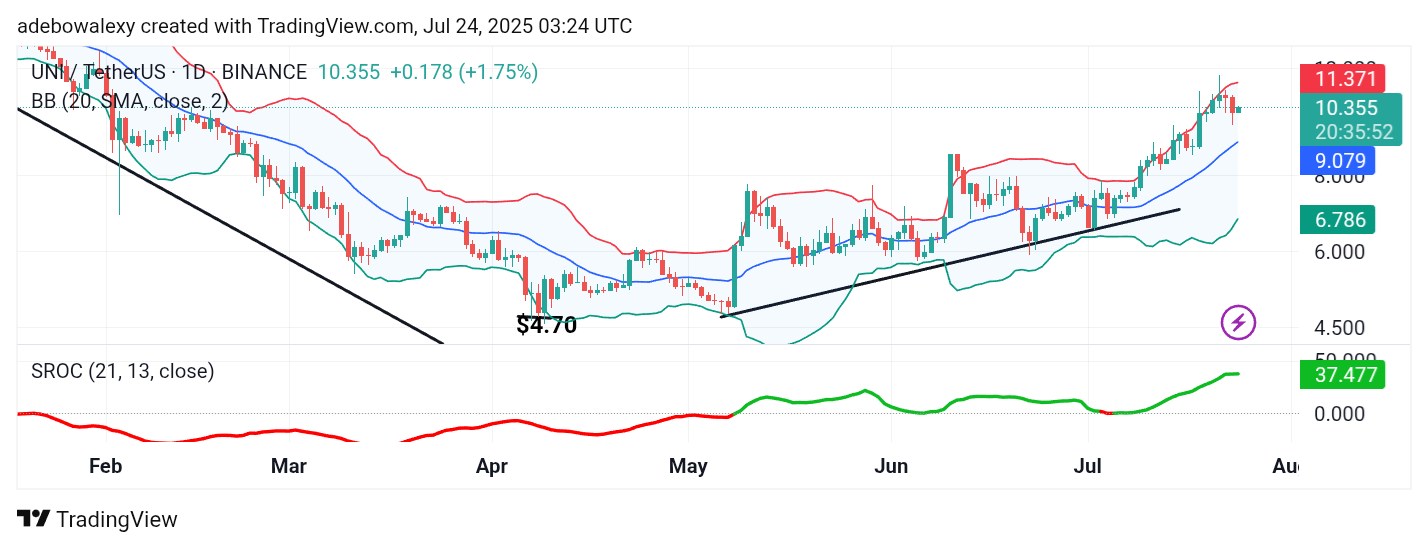
Price action in the Uniswap market has recently pulled back from the upper limit of the Bollinger Bands (BB) indicator over the past two sessions. This retracement extended into the previous session with greater intensity, but the current session tells a different story.
The latest price candle has appeared green and still sits above the middle band of the BB indicator. Additionally, the Smoothed Rate of Change (SROC) indicator remains above the equilibrium level and is still in positive territory, now pointing sideways, suggesting consolidation before another potential push upward.
Uniswap (UNI) Price Prediction: UNI/USDT Bulls Mount Resistance
Although the Uniswap market has experienced a modest price decline recently, today’s session (at the time of writing) suggests that bullish momentum remains intact. The latest price candle is small but holds the token above the middle BB band and at a notable distance from it.
The BB indicator also slopes gently upward, technically indicating that the general uptrend remains valid. Similarly, the SROC line stands above the equilibrium level. These technical signals collectively suggest that bulls are maintaining control and still have the upper hand.
Uniswap (UNI) Price Prediction: UNI/USDT Rebounds Smoothly Off the $10 Mark (4-Hour Chart)
On the Uniswap 4-hour chart, price action shows a smooth rebound off the lower limit of the BB indicator. The most recent candle is green, and the last two candles display lower shadows, indicating that buyers are actively supporting the market.
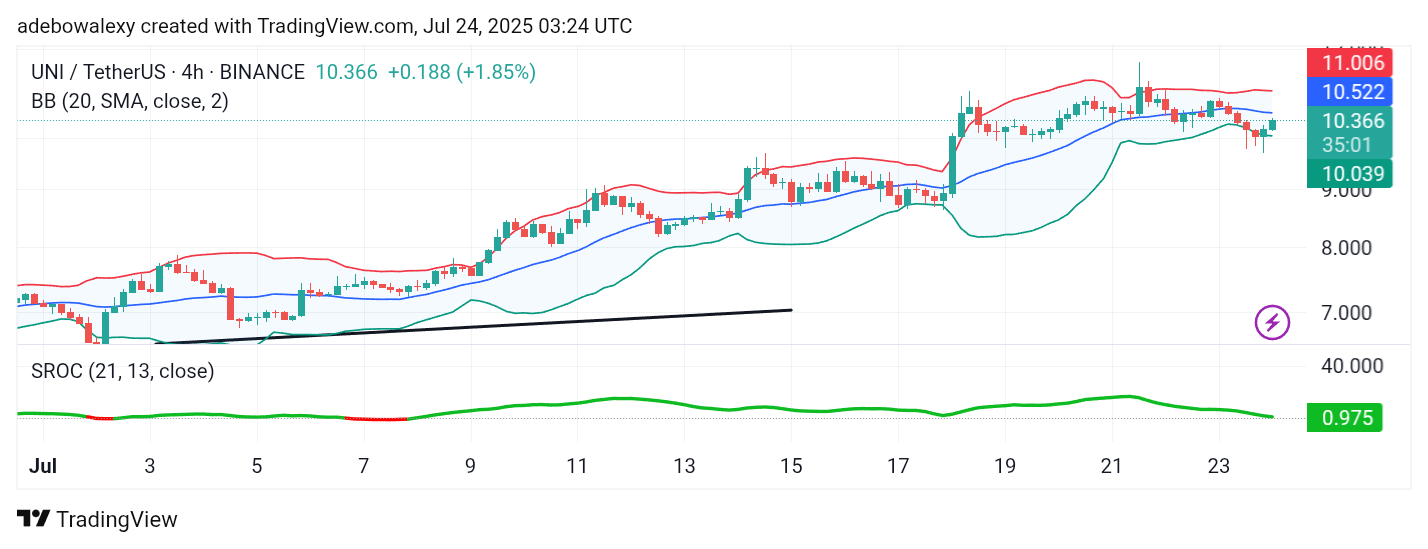
However, price remains below the middle band of the BB indicator. The SROC line is currently testing the equilibrium level, acting as a base. That said, with the current bullish trajectory, traders may look for confirmation once the market breaks above the middle BB band. This would suggest potential movement toward the $11.50 price level.