Uniswap (UNI) Price Prediction: UNI/USDT Seems to Be Escaping Downward Pull
Estimated Reading Time: 2 minutes
Don’t invest unless you’re prepared to lose all the money you invest. This is a high-risk investment and you are unlikely to be protected if something goes wrong. Take 2 minutes to learn more

Date: December 4, 2025
The Uniswap market has started rising. Its price action on the daily chart has just moved through an important technical landmark. However, the current session seems to be facing strong opposition, though overall, the market shows bullish tendencies.
UNI/USDT Long-Term Trend — Bearish (Daily Chart)
Key Price Levels
Resistance: $6.500, $7.000, $7.500
Support: $6.00, $5.50, $5.00
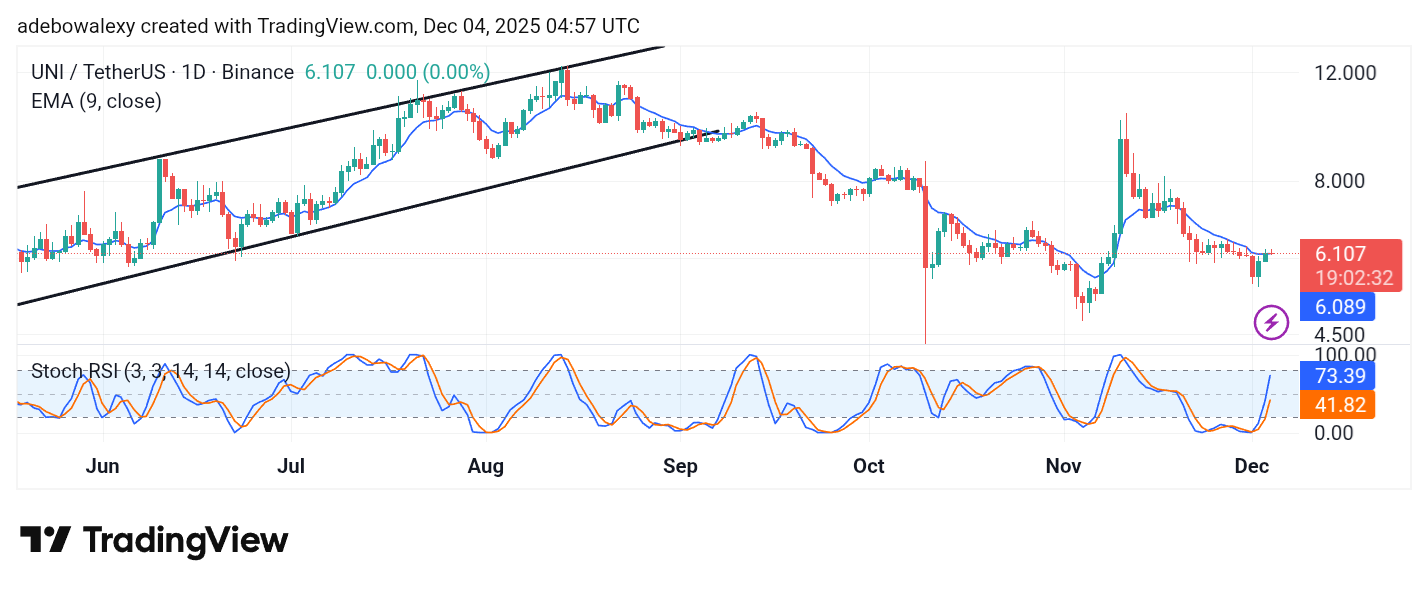
The current session in the Uniswap daily market shows a compressed red candle. However, it stands just above the 9-day Exponential Moving Average (EMA) line. While the market has only been bullish over the last two sessions, the Stochastic Relative Strength Index (SRSI) indicator lines can be seen rising quickly into the overbought region. The lead line is already past the 70 mark and did so very sharply.
Uniswap Price Prediction: UNI/USDT Has a Promising Base for a Bullish Outlook
Although on the daily chart price action has only moved slightly above the 9-day EMA curve, the fact that the ongoing session sits above the 9-day EMA signals something positive.
The latest candle on the chart is red, revealing the ongoing struggle. Also, it can be seen that the SRSI lines appear hyperextended given the modest price increase over the past two sessions. This signals an impending weakening in upside momentum, as buying forces may run out of steam soon.
Uniswap Price Prediction: UNI/USDT Retains Base of Support (4-Hour Chart)
Even on the Uniswap 4-hour chart, price activity remains consistent, holding above the 9-day EMA curve. Likewise, the latest price candle is red but keeps the token trading comfortably above the 9-day EMA.
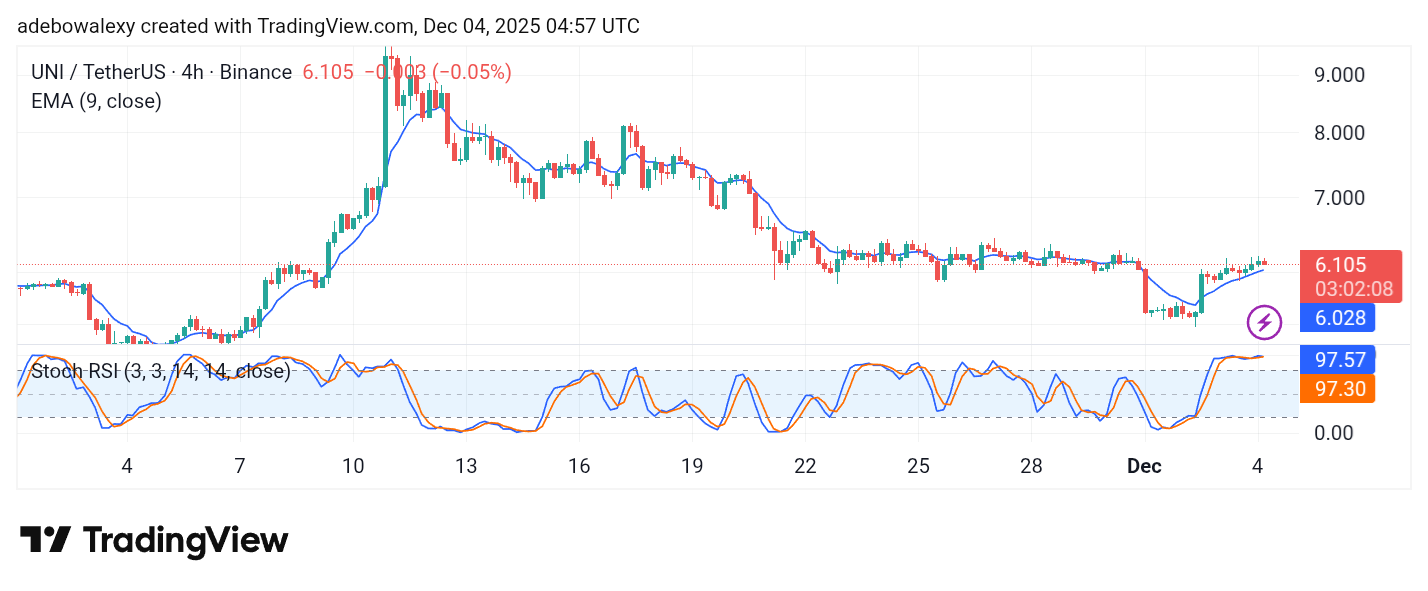
Meanwhile, the SRSI indicator lines can be seen in the oversold zone, with both lines remaining merged. The trajectory of this market still suggests that bullish forces are likely to keep pushing the market toward the $6.500 price level, considering its base above the 9-day EMA curve.