Chainlink (LINK) Resumes Uptrend, Poises To Reclaim The $42 High
Estimated Reading Time: 2 minutes
Don’t invest unless you’re prepared to lose all the money you invest. This is a high-risk investment and you are unlikely to be protected if something goes wrong. Take 2 minutes to learn more
Chainlink (LINK) Long-Term Analysis: Bullish
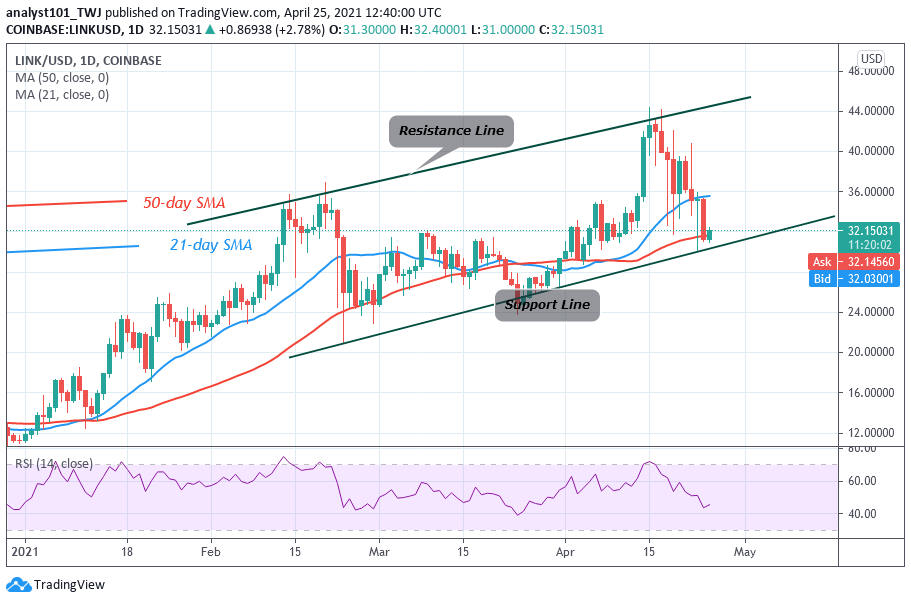
LINK price has fallen to $31 low after the resistance at $44 on April 24. There are bullish signals above the current support. Chainlink will resume an uptrend if the current support holds. In the previous price action, the altcoin resumed a downtrend after the formation of bearish double top on April 15 and 17. The bearish impulse on April 18 led to the resumption of range-bound move between level $35 and $42 for five days. The selling pressure resumed after the bears broke the $35 support. Meanwhile, buyers are pushing price upward as the current support holds.
Chainlink (LINK) Indicator Analysis
The 21-day and the 50-day SMAs are sloping upward indicating the uptrend. LINK is at level 45 of the Relative Strength Index period 14. It indicates that the crypto is in the downtrend zone and below the centerline 50.
Technical indicators:
Major Resistance Levels – $46, $48, $50
Major Support Levels – $30, $28, $26
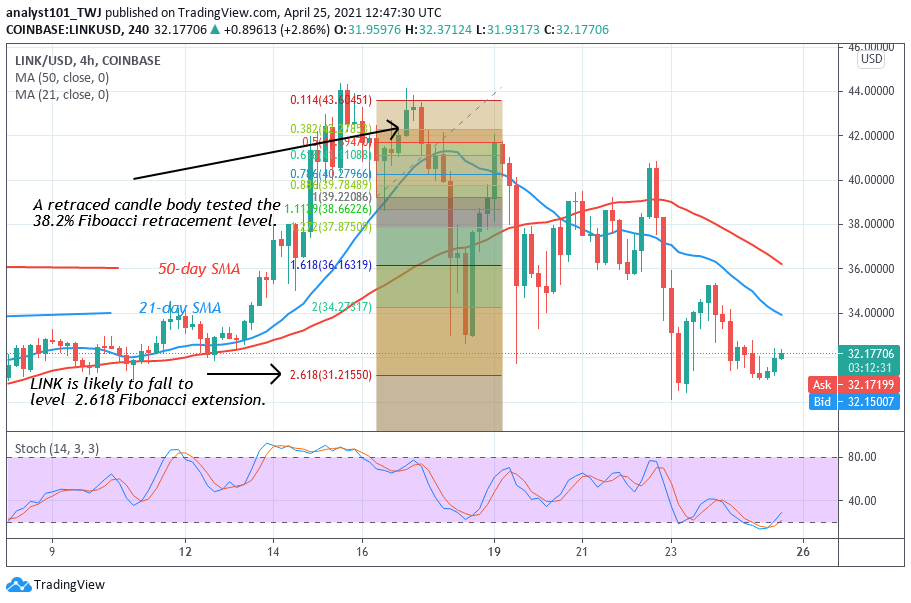
What Is the Next Direction for Chainlink (LINK)?
On the 4 hour chart, LINK is in a downward move. The Fibonacci tool has indicated the extent of the downtrend. On April 16 downtrend, a retraced candle body tested the 38.2% Fibonacci retracement level. This retracement implies that DOT will fall to level 2.618 Fibonacci extensions or the low of $31. 21. From the price action, the altcoin is reversing exactly at the 2.618 Fibonacci extension. Chainlink will resume an uptrend if the current support holds.
Note: cryptosignals.org is not a financial advisor. Do your research before investing your funds in any financial asset or presented product or event. We are not responsible for your investing results